
Earnings Volatility Crush: How to Manage and Profit


When an earnings report hits, implied volatility (IV) in the front-month options doesn’t drift lower — it collapses, often by 20–60% overnight. That collapse is the earnings volatility crush, and it’s the single most predictable structural event in the options market. The formal industry term is implied volatility crush, sometimes called IV crush.
Premium sellers: Enter short defined-risk structures (iron condors, credit spreads) when IV Rank exceeds 70 and the VRP z-score is positive, and close before or at the open after the print. The ATM straddle implied move tells you exactly what the market is pricing — if realized moves historically stay inside that range for the ticker, the edge is yours.
Long-premium buyers: Avoid buying ATM straddles or strangles into earnings unless the VRP z-score signals that event premium is genuinely cheap. Disciplineaiapp’s trade-intelligence engine flags this condition automatically, so you are not guessing at the signal.
Key Takeaways
Point | Details |
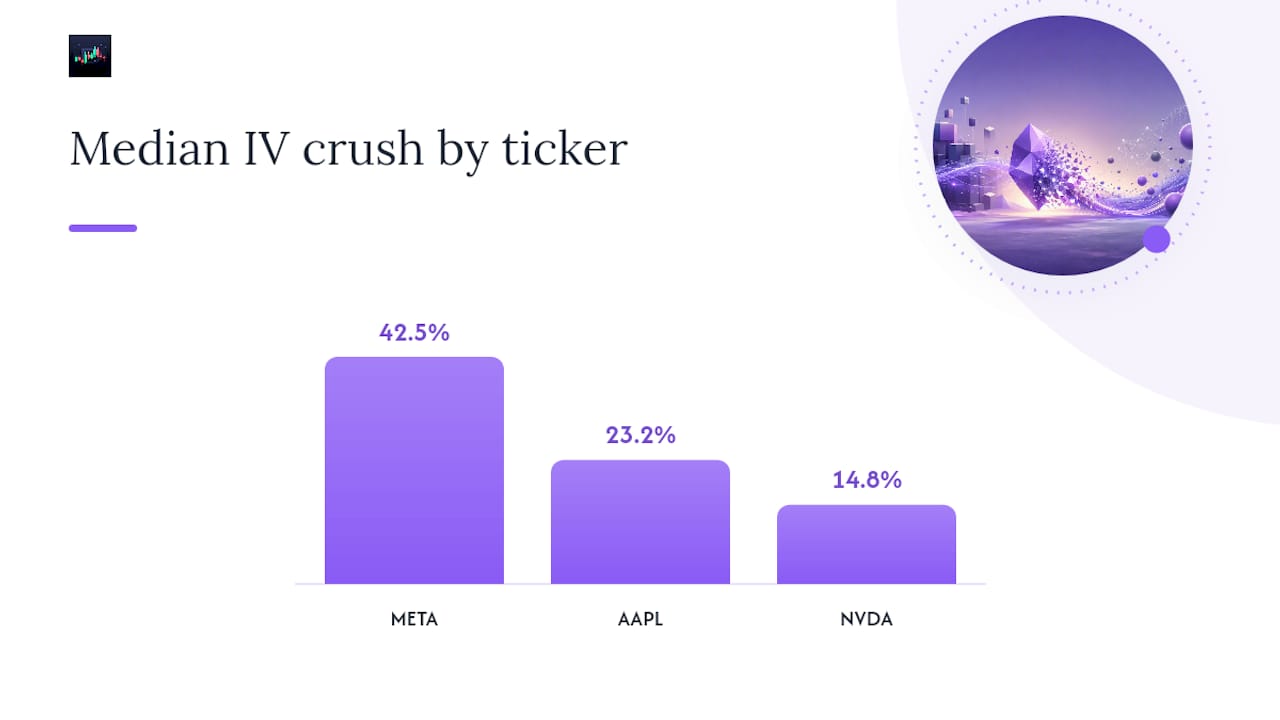
IV drops 20–60% after earnings | Front-expiry IV collapses at resolution; per-name medians vary widely (META ~42.5%, NVDA ~14.8%). |
Use IV Rank and VRP z-score | IV Rank above 70 and VRP z-score above 1.5 are the entry conditions for short-premium structures. |
Defined-risk structures limit the tail | Iron condors and credit spreads cap max loss; size so that max loss equals 2–5% of portfolio. |
Gap risk survives the crush | Earnings jumps exceed 90% probability in after-hours sessions; crush helps P&L but doesn’t eliminate directional gap losses. |
Disciplineaiapp automates the signal stack | The platform surfaces IV Rank, expected-move decomposition, and historical crush data to support pre-event sizing decisions. |
Table of Contents
What causes the earnings volatility crush in options pricing?
Implied volatility is the market’s forward-looking estimate of how much a stock will move, expressed as an annualized percentage. Realized volatility is what actually happened. The gap between the two — the volatility risk premium (VRP) — is where sellers extract their edge.
Vega is the option Greek that ties IV directly to price. An ATM option with a vega of 0.10 loses roughly $0.10 in value for every one-point drop in IV. When IV falls 30 points overnight, that same option sheds $3.00 in extrinsic value regardless of where the stock moves. That’s the crush working against you if you’re long.
The reason IV inflates before earnings is structural. Front-expiry options carry the event variance — the uncertainty about what the earnings print will reveal. Earnings are a major scheduled source of cash-flow information, and valuations respond directly to that news. The term structure inverts into backwardation: front-month IV spikes while back-month IV stays relatively flat, because the event variance is concentrated in the near expiry. The moment the report is released, that uncertainty resolves. The event variance is removed from the pricing model, and front IV snaps back toward the baseline.
The ATM straddle is the cleanest practical measure of how much the market is pricing in. Add the call and put prices at the nearest strike to the current stock price, and you get the implied expected move in dollar terms. Divide by the stock price for a percentage. That number is what the market thinks the stock will move, in either direction, by expiration. VRP z-scores and IV Rank tell you whether that implied move is rich or cheap relative to history — the two decision signals that separate disciplined earnings trades from coin flips.
When does IV ramp, and how large is the crush?
The ramp typically begins 8–10 trading days before the earnings date, but it accelerates sharply in the final 48–72 hours. That last-minute spike is where the event premium is most concentrated and where sellers get the best entry. After the print — whether the company beats, misses, or meets — IV resolution is nearly instantaneous. By the next morning’s open, front-month IV has already repriced.
The range is wide because crush size depends on several factors. A utility stock with low baseline realized vol and a predictable earnings pattern has a smaller event share and a smaller crush. Second, days to expiry: a weekly option expiring two days after earnings carries almost pure event variance, so the crush is proportionally larger than for a 45-day option where the event is a smaller fraction of total variance.
Per-name differences are large enough to matter in sizing. Historical median crush figures show META at roughly 42.5%, AAPL at roughly 23.2%, and NVDA at roughly 14.8%. Those aren’t interchangeable. Selling a short straddle on NVDA expecting a META-sized crush will leave you disappointed and undersized on premium collected.
A quick vega illustration
Vega loss alone: 30 × $0.12 = $3.60 per contract per share, or $360 per standard 100-share contract, before any directional move is factored in. A Earnings-watcher shows an $8 ATM straddle falling to $3.80 after a modest +3% stock move when IV collapses from ~80% to ~30%. The stock moved in your favor — and you still lost money. That’s the crush in action.
How IV crush affects your option P&L
The core principle: extrinsic value is what the crush destroys. Intrinsic value (how deep in the money an option is) is unaffected by IV. ATM and out-of-the-money options are pure extrinsic value, so they absorb the full force of the crush. Deep ITM options with high intrinsic value and low extrinsic value barely feel it.
Pre-event vs. post-event ATM straddle reprice
The crush overwhelmed the delta gain.
Who wins from IV crush:
Short iron condors and credit spreads: collected premium at high IV, and the crush reduces the value of the short options faster than the longs.
Calendar spreads: the front-month short leg collapses harder than the back-month long leg, capturing the term-structure differential.
Short straddles and strangles: maximum beneficiaries of the crush, though they carry unlimited directional risk if the stock gaps beyond the expected move.
Who loses:
Long ATM straddles and strangles bought into the event: the most common retail mistake. Even a correct directional call can produce a loss if IV collapses faster than the delta gain accumulates.
Long single-leg calls or puts purchased for earnings plays: the crush hits the extrinsic value immediately, and the stock needs to move well beyond the implied expected move to generate net profit.
Gamma scalpers who bought event premium: the crush compresses the gamma profile, reducing the value of the dynamic hedging they paid for.
One important caveat: earnings announcements trigger price jumps with over 90% probability in after-hours sessions, which means sellers face real gap risk. The crush helps your P&L, but a gap that exceeds the implied expected move can still produce a net loss on a short straddle. Defined-risk structures exist precisely to cap that exposure.
Trading strategies and risk management rules for earnings IV
The goal is a repeatable process, not a one-time trade. Here’s how to build one.
Entry and exit checklist
Pull IV Rank and IV Percentile for the ticker at least 5 trading days before earnings. IV Rank above 70 means current IV is in the top 30% of its 52-week range — a necessary condition for selling premium.
Check the VRP z-score. A z-score above 1.5 confirms that implied vol is statistically elevated relative to realized vol, not just elevated in absolute terms. This is the core decision signal for structure selection.
Measure the ATM straddle implied move. Compare it to the stock’s historical realized moves on past earnings dates. If the implied move is larger than the median historical move, the premium is rich.
Look up per-name historical crush. A ticker with a median crush of 40%+ is a better candidate for short premium than one with a 15% median crush.
Select structure based on signal strength. High IV Rank + high VRP z-score: short iron condor or credit spread. Moderate signal: calendar or diagonal to isolate the term differential. Low IV Rank or cheap VRP: consider a long straddle only if the implied move looks genuinely underpriced.
Set your exit before you enter. Close the position at the open after earnings, or set a limit order to close at 50% of max profit. Do not hold short premium through the next trading session hoping for more decay.
Sizing and defined-risk rules
The fat left tail is real: short-premium strategies win roughly two-thirds of the time, but the losing third can include gaps of 15–25% that dwarf the premium collected. Defined-risk spreads (iron condors, vertical spreads) cap the max loss at the spread width minus premium collected — size the position so that max loss equals your pre-set risk budget, not your “expected” loss.
Spread width matters. A $5-wide iron condor on a $100 stock collects less premium than a $10-wide condor, but the max loss is also half as large. For high-crush names with predictable move ranges, narrower spreads at higher IV Rank can produce better premium-to-risk ratios than wide spreads at moderate IV.
Pro Tip: Combine front/back expiry differential calibration with strike placement to limit gap exposure. Sell the front-week expiry (capturing maximum event variance) and buy the next-week expiry as a hedge. Place short strikes at or just outside the 1-standard-deviation expected move derived from the ATM straddle. This structure captures the crush on the front leg while the back-month long limits the gap loss if the stock blows through your short strike.
The ORATS earnEffect metric — calculated as (IV with earnings minus IV ex-earnings) divided by average daily move — quantifies exactly how much of current IV is attributable to the event. Higher earnEffect values indicate a larger expected crush and stronger candidates for short-premium structures.
How trade-intelligence tools improve earnings IV decisions
The workflow described above requires pulling five or six data points before sizing a single trade. Done manually, it’s slow and error-prone. Done systematically, it’s repeatable.
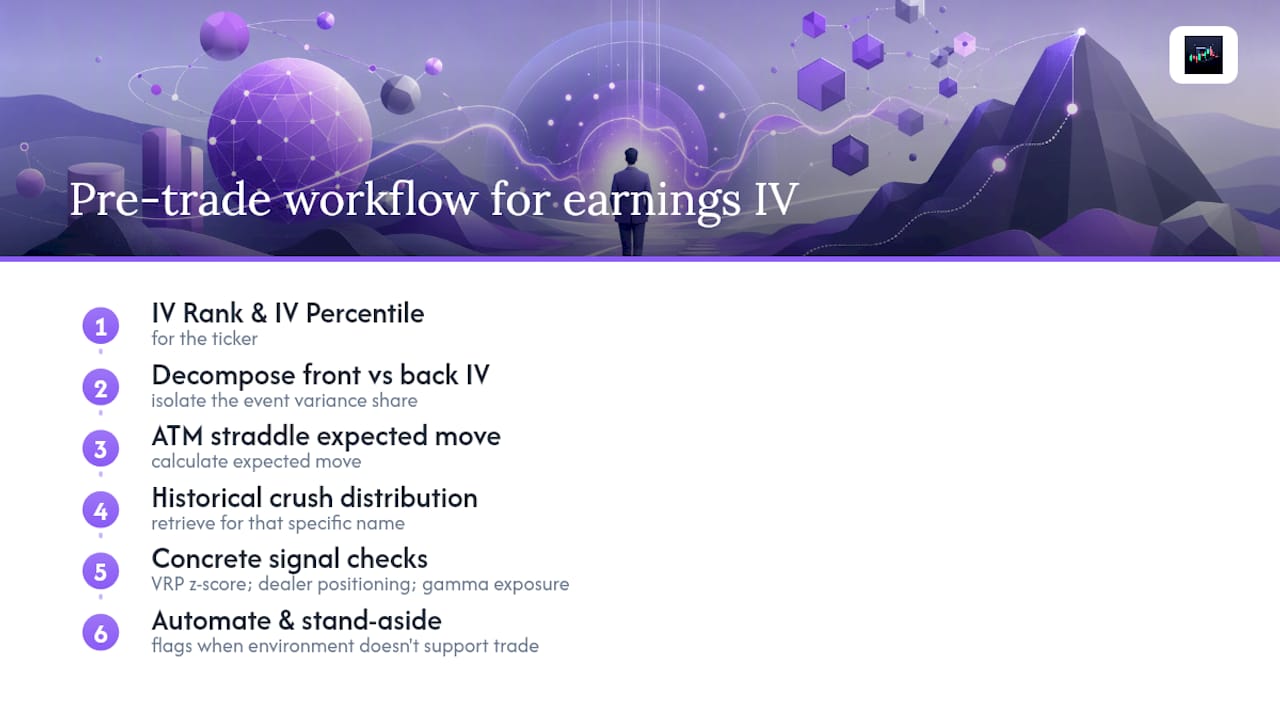
A structured pre-trade workflow looks like this: pull IV Rank and IV Percentile for the ticker, decompose front vs. back expiry IV to isolate the event variance share, calculate the ATM straddle expected move, and retrieve the historical crush distribution for that specific name. That last step matters most — per-name crush is stable enough to be worth looking up, and the same earnings quarter can produce dramatically different crush percentages across tickers.
Tools that surface these signals in one place materially change trade outcomes. Concrete signals that shift decision quality include: VRP z-score relative to the ticker’s own history, historical crush distribution (median, 25th, 75th percentile), dealer positioning and gamma exposure near key strikes, and expected-move decomposition separating event variance from baseline variance. These aren’t nice-to-have additions — they’re the difference between a sized, structured trade and a guess.
Disciplineaiapp’s AI trade analysis automates this signal stack. The platform scans for IV Rank, expected-move decomposition, and historical event patterns across multiple assets and timeframes, then generates confidence-scored trade setups with execution guidance. For earnings trades specifically, the stand-aside protection feature flags when the signal environment doesn’t support a trade — preventing the common mistake of forcing a position because earnings are “coming up” rather than because the setup is actually there. Evaluating your earnings trades with real data after each event is how the edge compounds over time.
The discipline gap is where most traders lose money
Most options traders understand IV crush conceptually. They know premium deflates after earnings. They still buy ATM straddles the day before the print because the stock “has to move.” That gap between understanding and execution is where the real losses accumulate.
Earnings trading is risk budgeting, not hero trading. The edge in short-premium earnings strategies is structural and probabilistic — it works over a large sample of trades, not on any single event. A trader who sizes correctly, uses defined-risk structures, and closes at the open after earnings will outperform one who sizes large, sells naked premium, and holds for extra decay. The math is straightforward; the behavior is the hard part.
Plan the trade before the IV ramp starts. By the time IV is spiking in the final 48 hours, you should already have your structure selected, your strikes placed, and your exit rule written down. Changing the plan mid-ramp because the premium looks “even better now” is how traders end up oversized into binary events. Use a checklist or an automated system to enforce the rules you set when you were thinking clearly.
One structural reality worth accepting: for the most liquid large-cap names, algorithmic price adjustment is nearly instantaneous at announcement. Retail traders trying to react to the print in real time are trading against systems that have already moved the price. The edge for retail options traders is pre-event positioning, not post-announcement reaction.
Disciplineaiapp automates the signals this guide describes
Pulling IV Rank, VRP z-scores, historical crush distributions, and expected-move decompositions manually before every earnings event is the kind of work that either gets skipped under pressure or done inconsistently. Disciplineaiapp consolidates that signal stack into a single AI-powered workflow — scanning for elevated IV Rank, flagging rich event premium via VRP analysis, and surfacing historical crush data for the specific ticker you’re trading.

The platform’s stand-aside protection prevents entries when the signal environment doesn’t support a trade, and its trade journaling and AI autopsy features let you measure your earnings-trade outcomes against the signals that generated them. For options traders who want the discipline of a systematic pre-event checklist without building it from scratch, the Discipline AI learning center is the starting point. Download the app on iOS or Android and run your next earnings setup through the platform before you size the position.
Sources
This article is general information, not a substitute for advice from a qualified financial advisor. Consult a qualified financial professional about your own circumstances before acting on anything here.
Recommended

Comments