
Entry Trigger Rules: The Trader's Practical Playbook


An entry trigger rule is a precise, testable condition that tells you exactly when to place an order — not when a setup looks interesting, but when a specific, measurable event has occurred. The difference matters more than most traders admit.
Here is the three-step action you can apply to any live chart right now:
Identify the setup: Define the price level or pattern that puts the trade on your radar (e.g., price approaching a prior swing high with rising volume).
Confirm the signal: Require at least two independent confirmations before touching the order ticket — price action, momentum, and volume are the three most reliable dimensions.
Place the order with constraints: Set your trigger type (stop, MIT, or LIT), attach a limit buffer to cap slippage, and log the pre-trade checklist result before execution.
Backtest every rule on at least 30 historical samples before going live. Most platforms — TradeStation, NinjaTrader, Thinkorswim — let you code trigger conditions directly into order templates or strategy scripts. Start there.
Key Takeaways
Precise, testable entry trigger rules with multi-factor confirmation and realistic backtesting are the foundation of repeatable trading edge.
Point | Details |
Write rules with six fields | Every rule needs instrument, timeframe, entry condition, confirmation stack, trigger type, and execution constraints before it is tradable. |
Require three independent confirmations | Price action, momentum, and volume or liquidity context reduce false signals and convert hope-based trades into plan-based ones. |
Match trigger type to scenario | Use Last or Ask triggers for equities and futures breakouts; use LIT for options and illiquid names to control fill price. |
Backtest with realistic execution models | Include slippage, commission, and out-of-sample testing; track win rate, expectancy, max drawdown, and fill rate. |
Enforce disqualification filters | Block entries when spread exceeds threshold, volume is below minimum, news is within 30 minutes, or higher-timeframe trend conflicts. |
Disciplineaiapp automates rule enforcement | The platform scans for setups meeting your entry criteria, scores confirmations, and tracks execution quality against your rule expectations. |
Table of Contents
What entry trigger rules actually are and why trigger type changes everything
How to backtest entry trigger rules so the results mean something
Mapping your written rule to real order fields in your platform
Why rules beat intuition, and what traders get wrong about discipline
Disciplineaiapp enforces your entry rules so you do not have to
What entry trigger rules actually are and why trigger type changes everything
Trigger type is the most underestimated variable in execution. Two traders can write identical entry conditions and get completely different fills because one chose a Last trigger and the other chose an Ask trigger. Here is what each type does.
Last, Bid, and Ask triggers differ in which price tick activates the order. A Last trigger fires when the most recent trade print reaches your price. A Bid trigger fires when the bid touches your level. An Ask trigger fires when the ask touches it. For a buy stop order, using Ask instead of Last means the order activates sooner, since the ask is always at or above the last trade price. That sounds like a minor detail until you are trading a thinly liquid stock and the ask is $0.30 above the last print.
MIT (Market If Touched) converts to a market order the moment price touches your trigger level. It guarantees a fill but not a price. LIT (Limit If Touched) converts to a limit order at the trigger, so you control the fill price but risk not getting filled at all if price blows through your level. On equities, MIT is common for stop entries on liquid names. On options, where spreads can be wide and liquidity thin, LIT is almost always the safer choice because a market order into a wide spread is an immediate loss.
Stop vs. If-Touched semantics add another layer. A buy stop sits above the current price and triggers when price rises to it. A buy If-Touched sits above the current price but is used in a different context: it assumes price will pull back to the level from above, making it a mean-reversion tool rather than a breakout tool. Confusing the two is a common source of unintended entries.
Exchange and platform tick rules matter here. Some platforms require a full trade tick at or through the stop price before triggering — this is the “Last” behavior. Others allow a bid or ask touch. Bad-tick protection, when available, filters out erroneous prints that would otherwise trigger your order on a phantom spike.
Trigger Type | Activates On | Best For | Risk |
Last | Trade print at level | Liquid equities, futures | Slightly slower activation |
Bid | Bid touches level | Sell stops on equities | Can trigger before actual trade |
Ask | Ask touches level | Buy stops on equities | Activates before trade confirmation |
MIT | Price touches level | Breakout entries needing fills | No price guarantee |
LIT | Price touches level | Options, illiquid names | May not fill on fast moves |
Buy Stop | Price rises to level | Trend breakouts | Slippage on gap opens |
Buy If-Touched | Price falls to level | Pullback/mean-reversion | Wrong direction assumption |
Pro Tip: Enable server-side bad-tick protection on any platform that offers it. A single erroneous tick on a low-volume name can trigger a stop and fill you at a price that never actually traded. TradeStation and NinjaTrader both offer tick validation settings — check the order routing preferences before you go live.
Common entry patterns and when each one earns its place
Not every pattern fits every strategy. Here is a concise catalog with honest notes on when each one works and when it does not.
Breakout above resistance Price closes or trades through a defined resistance level with volume above its 20-period average. Best for trend-following strategies on daily or 4-hour charts. The risk is false breaks — price pokes through, triggers your entry, then reverses. Slippage is highest here because everyone’s stop is at the same level.
Pros: Catches the beginning of a move; clear invalidation level.
Cons: High false-break rate without volume confirmation; gap risk on equities.
Pullback to support or moving average Price retraces to a rising MA (commonly the 20 EMA or 50 SMA) or a prior breakout level that has flipped to support. Lower slippage than a breakout entry because you are buying into weakness rather than chasing strength. Works well for swing traders on the daily chart and intraday traders on the 15-minute or 1-hour.
Pros: Better risk/reward than a breakout entry; defined stop below support.
Cons: Requires patience; can miss the move if price does not retrace.
Inside bar or consolidation breakout An inside bar forms when the current bar’s high and low are both within the prior bar’s range. A break of the inside bar’s high or low triggers the entry. Common in forex and futures where price compresses before a directional move.
Pros: Tight stop placement; clear trigger level.
Cons: Works best in trending markets; generates noise in choppy conditions.
Momentum crossover (MA or MACD) A faster MA crosses above a slower MA, or the MACD line crosses above the signal line. Used by scalpers (1-minute to 5-minute) and intraday traders (15-minute to 1-hour). Lagging by nature, so entries come after the move has started.
Pros: Objective, codeable trigger; easy to backtest.
Cons: Lag means worse entry price; whipsaws in sideways markets.
Volume-validated breakoutVolume confirmation materially reduces false-break rate by requiring observable buying or selling pressure before entry.
Pros: Higher-quality signals; filters out low-conviction moves.
Cons: Misses some legitimate breakouts on low-float names; harder to automate on options.
False-break (stop hunt) reversal Price breaks a key level, triggers retail stops, then reverses sharply. The entry is on the reversal candle after the false break is confirmed. Used by experienced intraday traders who recognize liquidity sweeps.
Pros: Excellent risk/reward when correct; catches institutional order flow.
Cons: Requires experience to identify in real time; high failure rate for newer traders.
For options and futures specifically: wider bid/ask spreads mean breakout entries carry more embedded slippage. On futures, the tick size and contract multiplier amplify small execution errors. Always factor spread cost into your expected value calculation before entering.
How to design confirmation rules that actually hold up
Require at least three independent confirmations before entering any trade. That is not arbitrary — it is the minimum needed to separate a genuine setup from a coincidence. The three dimensions that work best together are price action, momentum, and volume or liquidity context.

Effective entry criteria cover multiple dimensions, and missing even one dimension typically means you are looking at a prospect, not a trade. The same logic applies here: a setup that passes price action and momentum checks but fails on volume is a watchlist item, not an entry.
The three-factor confirmation template:
Price action: Is price at a defined structural level (support, resistance, prior high/low, VWAP)? Is the trigger candle showing rejection or acceptance of that level?
Momentum: Does a momentum oscillator (RSI, MACD, or Stochastic) confirm the direction? Is momentum diverging or converging with price?
Volume or liquidity: Is volume above its recent average on the trigger candle? For crypto or futures, is there a liquidity event (sweep, absorption) confirming institutional participation?
Pre-trade discipline checklist:
Structure: Is price at a meaningful level, or is this a random mid-range entry?
Momentum: Does the oscillator confirm direction without being overbought/oversold against you?
Volume/liquidity: Is volume or open interest supporting the move?
Timeframe alignment: Does the higher timeframe (at least one step up) agree with the direction?
Execution quality: Is the spread within your maximum threshold? Is there a news event in the next 30 minutes?
Pro Tip: Keep your confirmation stack to three factors maximum. Adding a fourth or fifth indicator rarely improves signal quality — it usually just creates conflicting readings that make the rule untestable. Independence matters: two indicators derived from the same price data (RSI and Stochastic, for example) are not two confirmations. They are one.
Confirmation converts a hope-based trade into a plan-based trade. The distinction shows up in your backtest results: rules with explicit confirmation requirements produce tighter win-rate distributions and more predictable expectancy than rules that rely on a single trigger condition.
How to backtest entry trigger rules so the results mean something
Codify your entry condition, stop placement, and exit rule before running a single backtest. A rule you cannot write down precisely cannot be tested, and a rule that cannot be tested is not a rule — it is a preference.
Backtests must use realistic execution models, include slippage and commission, and run forward and out-of-sample testing to validate that trigger rules hold up outside the data they were built on. Here is the step-by-step checklist:
Define the universe and timeframe: Which instruments, which session hours, which chart resolution (tick, 1-minute, 5-minute, daily)?
Choose the execution model: Tick-accurate data produces the most reliable results for short-term strategies. Minute bars introduce look-ahead bias on intrabar trigger events.
Set the slippage model: Use at minimum one tick of slippage per side for liquid futures, and two to three ticks for equities with wider spreads. Options require a spread-based model.
Include commission: Even $0.65 per contract adds up across hundreds of trades. Omitting it inflates expectancy.
Run in-sample first: Optimize parameters on the first 60–70% of your data.
Run out-of-sample: Test on the remaining 30–40% without touching parameters. If performance degrades sharply, the rule is curve-fitted.
Forward test on paper: Run the rule in real time on a paper account for at least 20–30 trades before committing capital.
Core metrics to track:
Win rate: Percentage of trades that close profitably. A high win rate with a low average win/loss ratio is a warning sign.
Average win / average loss: The ratio tells you whether your edge is real. A 40% win rate with a 2:1 average win/loss ratio outperforms a 60% win rate with a 0.8:1 ratio.
Expectancy: (Win rate × average win) minus (loss rate × average loss). Positive expectancy is the minimum bar.
Max drawdown: The largest peak-to-trough equity decline. Tells you whether you can psychologically and financially survive the worst stretch.
Fill rate: On limit-based triggers (LIT), what percentage of triggered orders actually filled?
Slippage per trade: Compare planned entry price to actual fill. Persistent slippage above your model assumption means the rule needs a wider limit buffer.
Trade frequency: Too few trades (fewer than 30 in-sample) means the results are statistically unreliable.
That usually means the stop is too tight relative to normal volatility, producing many small wins and occasional large losses. The fix is not to widen the stop arbitrarily — it is to recheck whether the trigger level itself is structurally sound.
Make triggers visible on historical charts. If you cannot point to the exact bar where your rule fired on a historical chart, the backtest engine may be using a different price than you intended. Rounded price levels and tick-granularity data both affect reproducibility.
Copy-ready rule templates you can test and trade
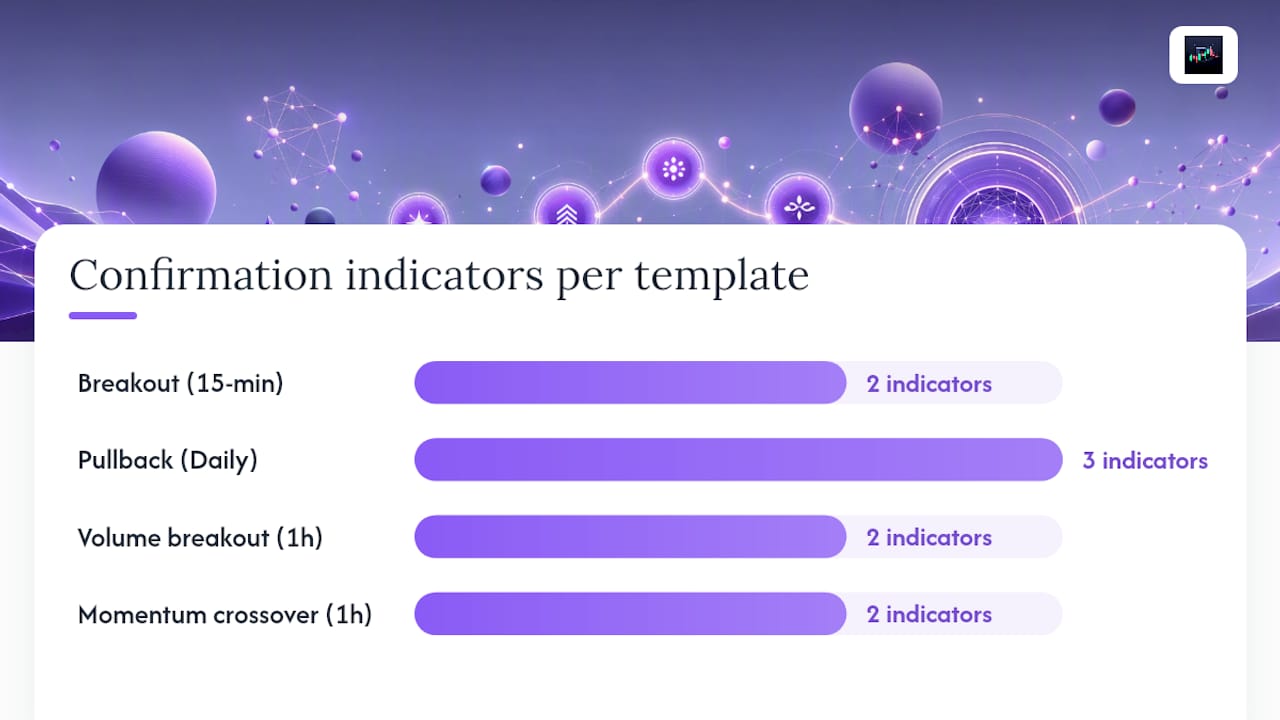
Every rule needs six fields before it is tradable: instrument, timeframe, entry condition, confirmation stack, trigger type, and execution constraints. Here are four templates with those fields filled in.
Template 1: Breakout entry
Instrument: S&P 500 E-mini (ES) futures
Timeframe: 15-minute
Entry condition: Price closes above the prior session’s high
Confirmation: Volume on breakout bar > 1.5x 20-period average; RSI(14) > 55
Trigger type: Buy stop (Last trigger)
Execution: Stop price = prior session high + 0.25 points; limit = stop + 1.0 point; GTC until end of session
Template 2: Pullback to moving average
Instrument: Any liquid equity (e.g., AAPL, SPY)
Timeframe: Daily
Entry condition: Price pulls back to the 20 EMA after a confirmed uptrend (price above 50 SMA).
Confirmation: Pullback candle closes above the 20 EMA; RSI(14) between 40–60; volume below 20-period average on pullback (healthy retracement)
Trigger type: Buy stop (Ask trigger) on the break of the prior candle’s high
Execution: Stop = low of pullback candle; limit = trigger + 0.2% of price; day order
Template 3: Volume-validated breakout
Instrument: Bitcoin (BTC/USD) or high-volume crypto pair
Timeframe: 1-hour
Entry condition: Price breaks above a defined resistance level with volume > 2x the 20-period average
Confirmation: MACD histogram turns positive on the breakout bar; higher-timeframe (4-hour) trend is up
Trigger type: MIT buy at resistance level
Execution: Limit = resistance + 0.5%; stop = resistance minus 1.5%; max slippage = 0.3%
Template 4: Momentum crossover
Instrument: EUR/USD forex
Timeframe: 1-hour
Entry condition: 9 EMA crosses above 21 EMA
Confirmation: MACD line crosses above signal line on the same or prior bar; price above the 200 SMA (higher-timeframe filter)
Trigger type: Market order at bar close (or LIT at the crossover price)
Execution: Stop = 1.5x ATR(14) below entry; target = 2x stop distance; session filter: London or New York overlap only
Fully filled example — ES futures breakout:
Field | Value |
Instrument | ES (E-mini S&P 500) |
Timeframe | 15-minute |
Entry condition | Close above prior session high (e.g., 5,420.00) |
Confirmation stack | Volume > 1.5x 20-bar avg; RSI(14) > 55; 1-hour trend up |
Trigger type | Buy stop, Last trigger |
Stop price | 5,420 |
Limit price | 5,421 |
Stop loss | 5,417.00 (prior 15-min swing low) |
Position size | Based on 1% account risk / (entry minus stop) |
Max slippage | 0.5 points |
TTL | GTC, expire at session close |
The rationale: the prior session high is a clean, objective level that other participants are watching. Volume confirmation filters out low-conviction pokes. The 1-hour trend filter prevents counter-trend entries, which is where most breakout rules leak edge.
For timeframe and indicator selection: match the lookback period to your holding time. A 9/21 EMA crossover on a 1-minute chart is a scalping tool. The same crossover on a daily chart is a swing signal. Using a short-period indicator on a long timeframe produces excessive lag; using a long-period indicator on a short timeframe produces almost no signals.
Mapping your written rule to real order fields in your platform
Always map a rule to three order fields before placing it: the trigger condition, the order type, and the execution constraints. Skipping this step is how a well-designed rule produces a bad fill.
Step checklist for placing a triggered order safely:
Validate the symbol and tick size. A rule written for ES (0.25-point tick) behaves differently if accidentally applied to NQ (0.25-point tick but different dollar value per tick).
Check the bid/ask spread against your maximum threshold. If the spread exceeds your limit buffer, do not enter.
Set the limit buffer wide enough to get filled on a fast move, but not so wide that you accept a fill at a price that breaks your risk model.
Enable bad-tick protection if the platform offers it.
Set the correct session flag (regular trading hours only, or extended hours if your rule was backtested on extended-hours data).
Confirm the order expiry (day order vs. GTC vs. GTD).
Example mapping using the ES breakout rule from the previous section:
Trigger condition: Ask > 5,420 (or Last >= 5,420 depending on platform setting)
Order type: Buy stop limit
Stop price: 5,420
Limit price: 5,421
Stop loss: Separate sell stop at 5,417.00
TTL: GTC, cancel at 4:00 PM ET
Max slippage: 0.5 points (if fill comes back above 5,421.75, cancel and reassess)
A few cautionary notes: On options, never use a market order for entry. The bid/ask spread on a single-leg option can be $0.50 or wider, and a market order fills at the ask — sometimes well above it if the market is moving. Use LIT with a limit set at the midpoint or one tick above. For odd-lot equity orders (fewer than 100 shares), some platforms route differently and fills can be worse. Around earnings, FOMC announcements, or CPI releases, even a well-designed trigger rule should be suspended — the spread widens, liquidity thins, and fills become unpredictable. Add a news-event filter to your disqualification checklist.
When not to enter: building your disqualification filter
The best trade you never take is the one that would have lost. Disqualification triggers are as important as entry triggers, and they should be just as explicit.
Effective entry criteria include explicit disqualification triggers that block a trade from progressing — the same way a pipeline quality gate blocks a prospect from advancing without meeting minimum criteria. Apply the same logic to trade setups.
Core disqualification triggers:
Spread exceeds threshold: If the bid/ask spread is more than 0.1% of price for equities, or more than 2 ticks for futures, the entry cost is too high relative to your expected move.
Volume below minimum: If the instrument is trading below its 20-period average volume by more than 30%, liquidity is insufficient for reliable fills.
News or earnings within 30 minutes: Economic data releases, Fed statements, and earnings reports create gap risk that invalidates any technical trigger.
Higher-timeframe trend mismatch: If the daily chart is in a downtrend and your 15-minute rule is generating a buy signal, the setup is counter-trend. Counter-trend entries require a different rule set, not the same one applied in reverse.
Failed confirmation: If the setup appeared but one or more confirmation conditions did not fire, the trade does not qualify. A partial confirmation is not a confirmation.
Consecutive losses: If you have taken three losing trades in a session, a pre-coded rule should require you to stop and review before placing another. This is a behavioral guardrail, not a technical one.
Automated pre-trade checks to implement:
Minimum average daily volume filter (e.g., 500,000 shares for equities, 1,000 contracts for futures)
Maximum spread percentage check at order placement
Economic calendar API integration to flag scheduled events
Higher-timeframe trend direction check (price above or below 50-period MA on the next timeframe up)
When a setup fails disqualification, move it to a watchlist rather than forcing the trade. The setup may qualify on the next bar or the next session. Converting a disqualified trade into a watchlist item is a discipline habit that compounds over time — it keeps your attention on the market without letting impatience override the rule.
Three annotated walkthroughs applying the rule templates
These three examples show how the templates and implementation mapping work on real setups. Each includes the exact rule text, confirmation checks, and order mapping.
Equity breakout with volume confirmation (SPY, daily chart)
Setup: SPY has been consolidating below $530 for five sessions. Volume has been declining through the consolidation, suggesting supply is drying up.
RSI(14) = 58 (pass). Daily trend = up, price above 50 SMA (pass).
Backtest note: Volume-backed breakouts show materially different fill and slippage profiles than low-volume breakouts.
Options trade using pullback to value (AAPL, daily chart)
Setup: AAPL is in an uptrend on the daily chart. Price pulls back to the 20 EMA at $195 after a three-day decline. Implied volatility (IV) is at the 30th percentile of its 52-week range, making long options relatively inexpensive.
Rule text: Buy a call option (one strike out of the money, 45 days to expiration) when price touches the 20 EMA, the pullback candle closes above the EMA, and IV rank is below 40.
Confirmation checks: Price closed above 20 EMA at $195.40 (pass). RSI(14) = 48, not oversold (pass). IV rank = 28 (pass). Volume on pullback was below average, confirming healthy retracement (pass).
Order mapping: LIT buy at the midpoint of the bid/ask spread. Limit = ask minus $0.05.
Implementation note: Never use a market order on options. The spread on a single AAPL call can be $0.20 or wider. A LIT order at the midpoint gets you a fair fill or no fill, which is the correct tradeoff.
Futures momentum entry (NQ, 15-minute chart, intraday)
Setup: NQ (E-mini Nasdaq-100) is trending up on the 1-hour chart. On the 15-minute chart, the 9 EMA crosses above the 21 EMA at 10:15 AM ET, after a brief pullback during the first 30 minutes of the session.
Rule text: Buy MIT at the 9/21 EMA crossover price if the MACD histogram is positive on the crossover bar, the 1-hour trend is up (price above 1-hour 50 EMA), and the time is between 9:45 AM and 11:30 AM ET (avoiding the open volatility window).
Confirmation checks: MACD histogram = +12 (pass). 1-hour 50 EMA = 19,850; current price = 19,920 (pass). Time = 10:15 AM (pass).
Order mapping: MIT buy at 19,925 (crossover price). Limit = 19,935 (10-point buffer).
Implementation note: The session time filter is not optional. NQ’s first 15 minutes produce outsized volatility that invalidates most crossover signals. Trading rules that hold up almost always include session filters for intraday strategies.
Why rules beat intuition, and what traders get wrong about discipline
The conventional wisdom is that experience makes you a better trader. That is partially true. What experience actually does, when it works, is encode rules into intuition over thousands of repetitions. The problem is that most traders never get enough clean repetitions to build reliable intuition, and the ones who think they have often confuse pattern recognition with confirmation bias.
A written, testable rule removes that ambiguity. It does not care how you feel about the trade. It does not care that you missed the last three setups and feel like you are “due.” It fires when the conditions are met and stays quiet when they are not. That consistency is where edge lives.
The most common failure mode is not a bad rule. It is a good rule that gets manually overridden at the worst moment. A trader sees a setup that almost qualifies, decides the confirmation is “close enough,” and enters anyway. The trade loses. The rule did not fail — the discipline did. Journaling and execution analytics enforce discipline by comparing planned trigger and limit expectations to realized fills and slippage, creating a paper trail that makes override behavior visible and measurable.
The second failure mode is complexity. Traders add confirmations to fix a losing streak, then add more, until the rule has seven conditions and fires twice a year. A rule that does not generate enough trades to be statistically meaningful is not a rule — it is a superstition with extra steps. Keep the confirmation stack to three factors. Test it. If it does not work with three, adding a fourth will not save it.
Pro Tip: Log every pre-trade checklist result, including the trades you did not take. The “did not take” log is often more instructive than the trade log. If you are consistently skipping trades that would have won, your disqualification filter is too aggressive. If you are consistently taking trades that fail the checklist in hindsight, your discipline is the problem, not the rule.
Disciplineaiapp enforces your entry rules so you do not have to
The hardest part of rule-based trading is not writing the rules. It is enforcing them in real time, under pressure, when a setup is forming and your instinct is pushing you toward the order button.

Disciplineaiapp automates the confirmation stack, runs disqualification filters before you see a setup, and scores execution quality against your rule expectations after every trade. The platform scans across multiple assets and timeframes simultaneously, flags setups that meet your defined entry point criteria, and assigns a confidence score based on multi-factor alignment — price action, momentum, volume, and higher-timeframe structure. Every triggered setup comes with an AI-generated rationale, so you can see exactly which conditions passed and which were borderline.
The trade journal captures pre-trade checklist results and compares planned trigger prices to actual fills, giving you the slippage and execution-quality data you need to refine your rules over time. The behavioral coaching layer tracks override patterns and flags when your manual decisions are diverging from your stated rules. For traders who want to go further, the market replay simulation lets you practice applying entry trigger rules under fog-of-war conditions before committing capital.
Visit the Discipline AI Learning Center to explore rule templates, see how AI-assisted confirmation works in practice, and start a free trial.
Sources
This article is general information, not a substitute for advice from a qualified financial advisor. Consult a qualified financial professional about your own circumstances before acting on anything here.
Recommended

Comments