
Validate Your Edge in 50–100 Trades: R-Multiple Trading for Traders


An R-multiple is your trade’s profit or loss divided by the dollar amount you risked at entry, so a $300 gain on a $150 stop is +2R regardless of whether you traded 10 shares or 10,000. That single ratio is what makes r multiple trading useful: it standardizes results across position sizes and instruments, and it’s the raw material for calculating expectancy. Start logging your planned stop before every entry. Without it, none of this works.
TL;DR:
Tracking initial risk at entry is crucial, and moving stops or recalculating R after trades distort data accuracy.
Subtracting costs such as commissions and slippage before calculating R-multiplies prevents inflated results and misrepresented performance.
R-multiple analysis across markets shows that positive expectancy often relies on consistent sizing and accurate partial-exit calculations.
Analyzing trade distribution and expectancy over at least 100 trades helps confirm if a strategy has a genuine edge or relies on outliers.
Automated journaling tools enforce discipline by preventing retrospective stop adjustments and ensuring authentic R-multiple records.
Table of Contents
What Is R and How Do You Calculate It?
R stands for your initial risk in dollars, the distance from your entry price to your stop, multiplied by your position size. It’s the denominator in every R-multiple calculation, and it gets fixed the moment you enter the trade. The formula itself is simple:
R-multiple = Realized P&L ÷ Initial Risk ®
If you buy a stock at $50 with a stop at $48 and trade 100 shares, your initial risk is $200. Close the trade at $56 and you’ve made $600, which is +3R. The math is basic. The discipline behind it is not.
Two rules keep R-multiple tracking honest:
R is locked at entry. If you move your stop after the trade is live, tighter or looser, your original R does not change. R is set at entry and recalculating it after the fact corrupts your data, because you’d be measuring a different trade than the one you actually took.
Costs come out before you divide. Subtract commissions and average slippage from your realized P&L first, then divide by R. Skipping this step inflates every single result in your journal, sometimes by a meaningful margin on high-frequency strategies.
Get these two rules wrong and your entire distribution of trades becomes noise dressed up as data.
How Do You Calculate R-Multiples Across Different Markets?
The formula doesn’t change by asset class, but the inputs do. Worked calculation examples across stocks, crypto, and forex show how the same math applies whether you’re counting shares, contracts, or pips.
Stock swing trade, winner. You buy 200 shares at $40 with a stop at $38.50. Initial risk: $1.50 × 200 = $300. You exit at $46. Profit: $6.00 × 200 = $1,200. Result: $1,200 ÷ $300 = +4R.
Crypto trade with fees, loser. You go long 0.5 BTC at $60,000 with a stop at $58,800. Initial risk: $1,200 × 0.5 = $600. The stop gets hit, and after $15 in exchange fees your realized loss is $615. Result: negative $615 ÷ $600 = −1.03R. That extra 0.03R is pure fee drag, and it’s exactly what disappears if you forget to subtract costs first.
Forex pip trade, partial loss. You short EUR/USD at 1.1000 with a 30 pip stop and $10 per pip. Initial risk: 30 × $10 = $300. Price stalls and you exit early at breakeven minus 15 pips for $150. Result: negative $150 ÷ $300 = −0.5R.
Partial exits need a weighted calculation. If you scale out of half your position at +2R and close the rest at +1R, your blended result is (0.5 × 2R) + (0.5 × 1R) = +1.5R, not a simple average of the two exit prices. Journal each partial fill separately, then weight by the percentage of the position closed at each stage. That’s the only way multiple R trading strategies involving scaling stay accurate over time.
How Do You Read an R-Multiple Distribution?
A single trade’s R-multiple tells you almost nothing. A sizable sample of them, plotted as a histogram, helps indicate whether your strategy may have an edge. This is where r multiple trading analysis earns its keep, because expectancy is the number that separates a real strategy from a lucky streak.
The formula is straightforward: Expectancy = (Win Rate × Average Winning R) − (Loss Rate × Average Losing R). If you win 40% of trades averaging +2.5R, and lose 60% averaging −1R, expectancy comes out to (0.40 × 2.5) − (0.60 × 1) = 1.0 − 0.6 = +0.4R per trade. Over 200 trades risking 1% of capital each, that’s a meaningfully positive strategy, assuming your sizing stays consistent.
Reading the histogram itself matters as much as the formula:
A tall cluster right around −1R usually means your stops are working as designed, which is good.
A cluster of losses tighter than −1R often signals premature exits or panic closes before the stop was hit.
A long right tail of outsized winners can mean your edge depends on a handful of trades, which is fragile.
Benchmark check: expectancy ranges vary widely by trading style, from roughly +0.05R to +0.2R for scalping, up to +1.0R to +3.0R for position trading. Sample size matters just as much as the number itself; treat anything under 50 trades as noisy and wait for 100 to 200 before trusting the estimate.
Average R can mislead when one or two huge winners are propping up an otherwise mediocre distribution. Track rolling expectancy over your last 50 trades, not just the lifetime average, to catch strategy decay early.
How Should You Journal R-Multiples in Practice?
Your journal is only as good as what you record before the trade, not after. The minimum fields worth tracking are entry price, stop price, position size, planned R, exit price, realized R, and a tag for whether you followed your own plan.
Record the planned stop before you enter, not from memory afterward. Retroactive stop placement is the single most common way traders fool themselves into a better-looking track record.
If a trade is missing a recorded stop, don’t guess. Mark it as unverifiable rather than reconstructing an R value from what “felt right.”
Tag every deviation from plan separately from the R-multiple itself, so you can filter your data by rule-following trades only.
Automated trade syncing and auto-calculated R removes a lot of the manual error that creeps into spreadsheet journals, especially around fee subtraction and partial-exit weighting. A platform like Discipline AI’s automated trade journaling can capture the stop at order placement and calculate realized R without you touching a formula, which matters more than it sounds once you’re logging dozens of trades a week. Pair that with a look at how slippage distorts realized R so you know exactly where the gap between planned and actual performance comes from.
What Measurement Traps Distort Your R Data?
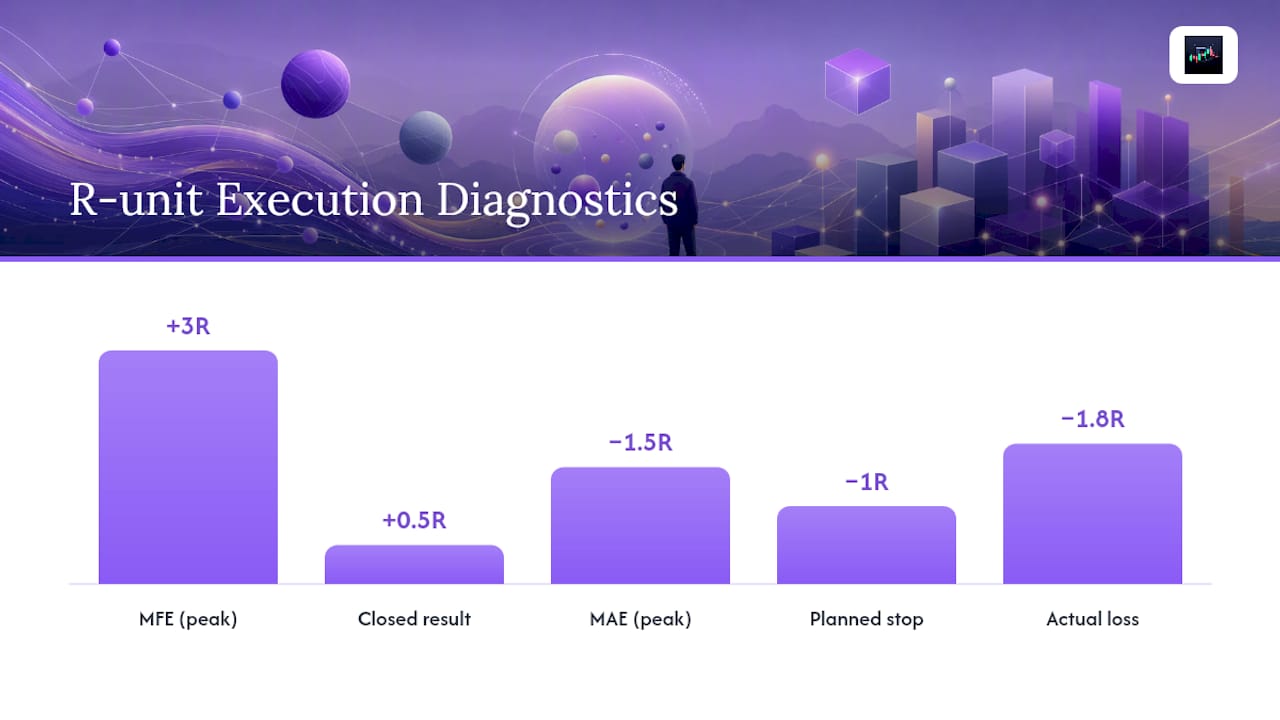
Slippage is the quiet killer of clean R data. Even a few pips or a couple of cents of adverse execution on every trade compounds into a materially different expectancy than your backtest suggested. Record the actual realized loss even when it blows past your planned R. If your stop was designed for −1R and a gap or a stop-skip turns it into −1.8R, log the −1.8R. Don’t cap it at −1R to make the spreadsheet look cleaner.
Tag every instance where execution deviated from the plan, whether that’s a moved stop, a skipped entry signal, or a fill far from your limit price. Over time, this tag becomes its own diagnostic layer, separate from your win rate or average R.
Recording MFE and MAE in R units, maximum favorable excursion and maximum adverse excursion, separates a bad setup from bad execution. If a trade’s MFE was +3R before it closed at +0.5R, the setup was fine and your exit management is the leak. If MAE consistently runs to −1.5R before trades recover, your stops might be placed inside normal volatility.
Pro Tip: Never retroactively change a logged R value, even when you know the stop was “wrong” in hindsight. Keep the original number and add a compliance tag noting the plan-vs-actual gap instead. That gap is often more diagnostic than the R-multiple itself.
How Do You Validate Your Edge From Your Last Trades?
Pull your last 50 to 100 trades and run them through this checklist:
Confirm every trade has a recorded entry, stop, and exit price.
Calculate initial risk ® for each trade using entry-to-stop distance times size.
Subtract commissions and slippage from realized P&L before dividing.
Compute each trade’s R-multiple and weight partial exits accordingly.
Calculate win rate, average winning R, and average losing R.
Plug those into the expectancy formula and check the result against style benchmarks.
Plot the full distribution as a histogram and scan for outlier dependence or clustering.
If expectancy is positive and doesn’t collapse when you remove your three best trades, keep trading the strategy as designed. If it’s positive only because of one outlier, or you’re seeing frequent losses beyond −1R, fix your execution before you scale size. If expectancy is flat or negative across 100+ trades, stop and rebuild the rules, not just the position sizing.
Why Most Traders Get R-Multiple Tracking Wrong
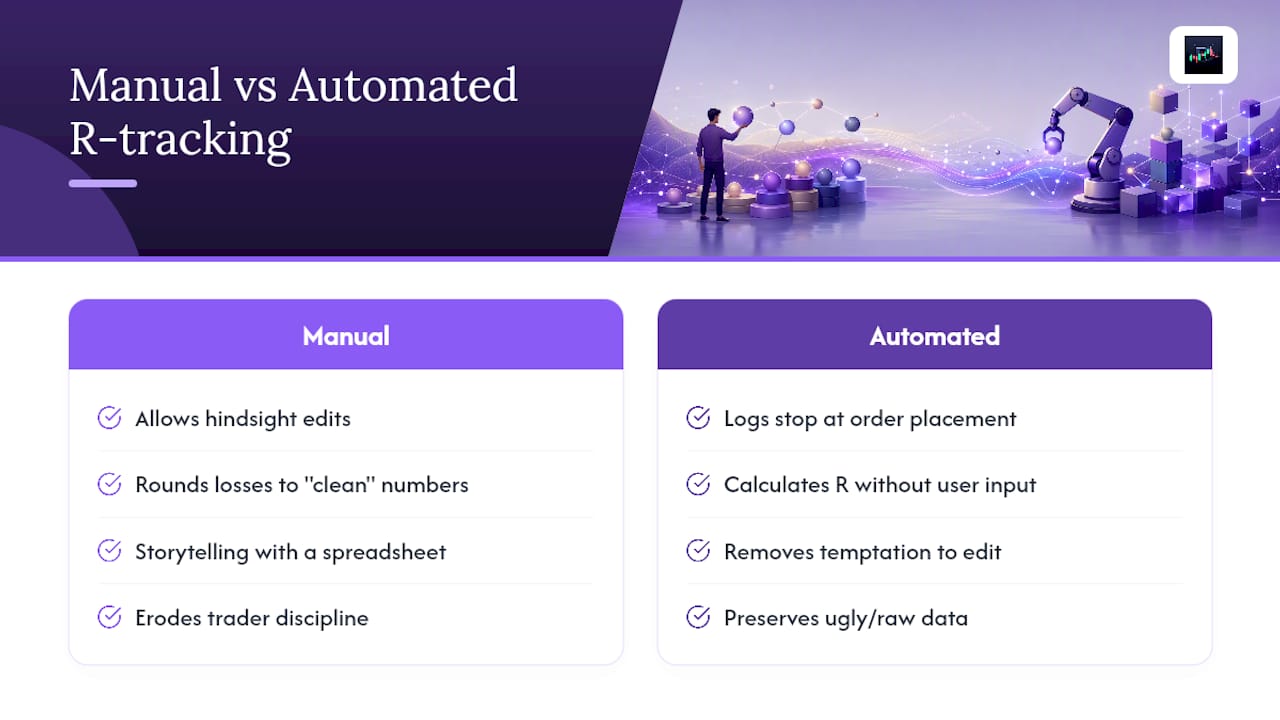
Most traders who track R-multiples still let hindsight creep into their numbers, quietly moving a stop after the fact or rounding a −1.4R loss down to −1R because it’s cleaner. That’s not measurement. That’s storytelling with a spreadsheet. The traders who actually improve are the ones who let the data stay ugly and look for the plan-versus-actual gap instead of erasing it.
Automation helps here more than most people expect, not because software is smarter, but because it removes the temptation to edit your own history. A system that logs the stop at order placement and calculates R without your input enforces the exact discipline that manual journaling tends to erode. If you want to see how tool-based tracking handles this in practice, Discipline AI’s learning resources walk through the setup.
— Tony
Sources
Recommended

Comments