
Validate a Trading Edge Without Risk With Discipline AI


You can decide in ordered stages whether your edge is real. Start with a capital-free edge check on your trade log; if the bootstrap confidence interval excludes zero and costs don’t erase the average win, move to a proper backtest, then out-of-sample or walk-forward testing, then paper trading. If the interval on expectancy straddles zero or costs eat more than half the gross edge, stop. Run an edge-level bootstrap report tonight before you do anything else.
TL;DR:
A capital-free edge check on your trade log must show a bootstrap confidence interval excluding zero before proceeding to backtesting.
Costs and market regime changes can erode an edge, so models should include realistic commissions, slippage, and diverse market conditions for validation.
Statistical significance requires bootstrap confidence intervals and corrections for multiple testing, with at least 30 trades needed for reliable inference.
Out-of-sample and walk-forward testing are critical to confirm that an edge is durable across unseen data and market regimes.
A strategy is only likely to be reliable if it passes all validation gates, including realistic execution at intended sizes and capacity stress tests.
Table of Contents
How Do You Validate a Trading Edge Step by Step?
Validating a trading edge is a gauntlet, not a single test. Each stage has a pass/fail line, and skipping ahead is how traders end up sizing a random walk.
Capital-free edge check. Pull your existing trade log (even 30 to 50 trades) and calculate expectancy, profit factor, and a bootstrap confidence interval on expectancy. Pass condition: the 95% CI lower bound sits above zero. A result like +0.081R expectancy with a CI that includes zero fails this gate, even though the average looks positive, because the interval still touches zero.
Rigorous backtest with point-in-time data and real costs. Rebuild the rule mechanically, apply commissions, spread, and slippage, and compare gross versus net returns. Pass condition: net expectancy stays positive after realistic cost assumptions, not just gross.
Robustness and anti-overfitting controls. Test nearby parameter values, run the strategy across at least two different market regimes, and check whether performance came from a handful of lucky trades. Pass condition: performance holds across a plateau of parameters, not a single lucky combination, and the strategy has a plausible causal reason to work in the regime you tested.
Reserved out-of-sample or walk-forward test. Lock the rule, then test it on data it has never seen. Pass condition: out-of-sample performance stays within a reasonable band of in-sample results, commonly expressed as walk-forward efficiency.
Paper or forward testing. Trade the exact rule live with no capital at risk, logging every signal in real time. Pass condition: the live signal count and win rate track what the backtest predicted, with no major divergence in execution timing.
Capacity and execution checks. Confirm the strategy still works at your intended position size, factoring in slippage and fill quality at that scale. Pass condition: net expectancy survives a cost stress test of 50 to 100% above baseline assumptions.
Gate decision. Only after all six stages pass do you allocate real capital, and even then you start small.
Each stage is cheap to run and expensive to skip. A trader who jumps straight to backtesting without the capital-free check often burns weeks optimizing a strategy that never had a real edge to begin with. Discipline AI’s evaluation guide walks through the first stage in more depth if you’re starting from a raw trade log rather than a coded strategy.
Backtesting Hygiene: Data, Point-in-Time Inputs, and Cost Modeling
A backtest is only as good as the data feeding it. Most inflated backtests aren’t the result of bad math. They’re the result of bad inputs that quietly leak future information into past decisions.
Start with point-in-time data. If your price feed reflects index membership, dividend adjustments, or contract specifications as they exist today rather than as they existed on the trade date, your backtest is testing a strategy that couldn’t have been traded historically. Document how you handle contract rolls and survivorship (delisted stocks, expired futures contracts) because both distort results if silently dropped.
Cost modeling matters just as much as data integrity:
Model commissions, bid/ask spread, and slippage explicitly, not as a flat afterthought percentage.
Account for financing or borrow costs on any position held overnight, especially leveraged or short trades.
Simulate partial fills on illiquid instruments instead of assuming every order executes at the quoted price.
Report gross and net results side by side so the cost drag is visible, not buried in a single Sharpe number.
Separate your development period, validation period, and out-of-sample period, and never let data from one leak into another.
That last point deserves emphasis because it’s where most self-taught testing falls apart. Every time you try a new parameter, a new filter, or a new entry rule and check it against the same dataset, you’re spending a “trial.” A practical backtesting checklist recommends writing unambiguous rules first, then logging every experiment you run against your data, a practice sometimes called K-counting. If you tested 40 parameter combinations and only report the best one, you’ve quietly discarded 39 pieces of evidence that your edge might be noise.
Lookahead bias is the other silent killer. Centered rolling windows (which use future data points to smooth a past value), full-sample normalization (scaling your entire dataset before splitting it into train and test), and indicators that reference a bar’s close before that bar has actually closed are the three most common leaks. Audit your code by asking a blunt question at every calculation step: could I have known this value on this exact timestamp using only data available up to that moment? If the answer is no, the backtest is compromised.
Pro Tip: Before you trust any backtest number, rerun it with a one-day lag added to every signal. If your returns collapse, you had lookahead bias hiding somewhere in the pipeline.
What Statistical Tests Confirm a Real Trading Edge?
Statistical significance separates a genuine edge from a lucky streak, and the test starts with the same trade-level metrics from your capital-free check, applied with more rigor.
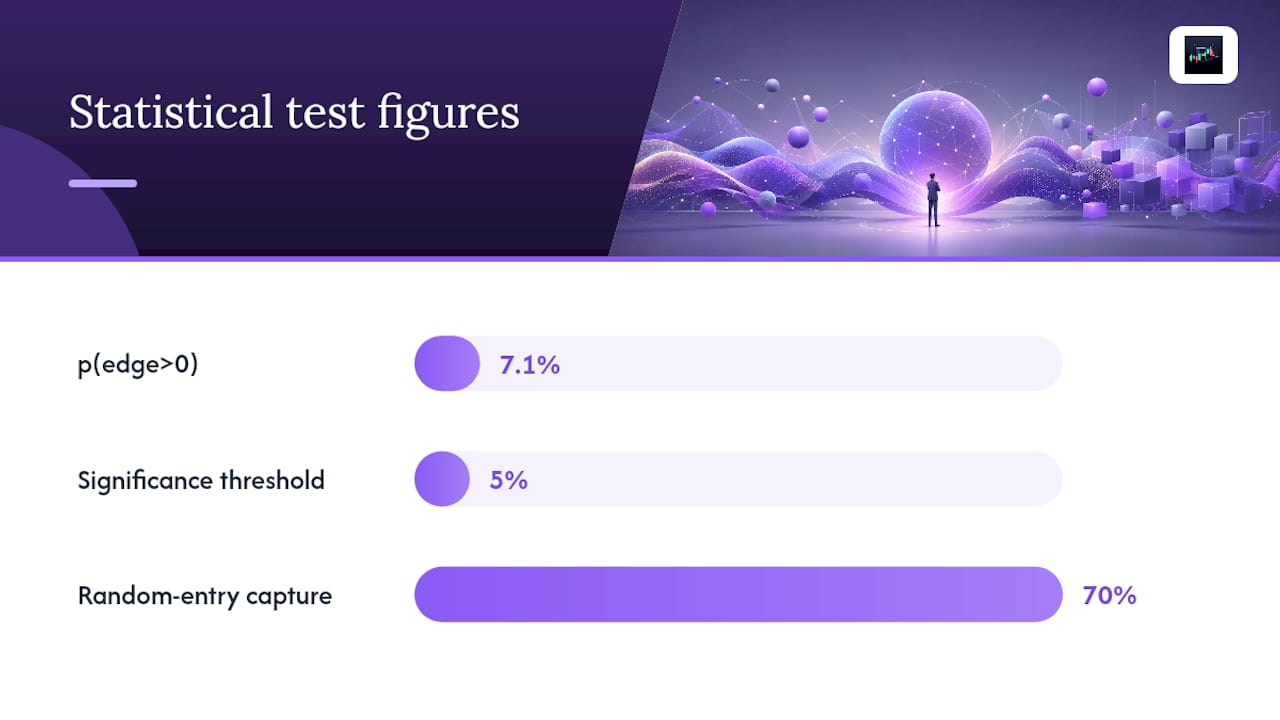
Run bootstrap confidence intervals on expectancy, profit factor, and System Quality Number (SQN) rather than relying on a single point estimate. Bootstrapping resamples your trade log thousands of times to build a distribution of possible outcomes, and it will report something like a p-value for the claim “edge is greater than zero.” A p(edge>0) of 0.071, as in one documented edge report, sits above the conventional 0.05 threshold, which means the result doesn’t clear the bar for statistical confidence even though the raw average looks profitable.
The next layer is correcting for multiple comparisons. If you tested 50 variations of a moving average crossover and picked the best one, you need to adjust your confidence accordingly:
Apply Bonferroni correction or a similar method when you’ve run more than a handful of parameter tests on the same dataset.
Calculate the Probability of Backtest Overfitting (PBO) or use deflated Sharpe ratio, both of which explicitly account for how large your search space was.
Keep an honest trial ledger listing every variant tested, not just the winner, since counting only the winning variant severely overestimates the strength of your evidence.
Run a permutation or random-entry reality check: shuffle your trade timestamps or replace your entries with random ones on the same instrument, and see if random performs nearly as well.
Sample size matters more than most traders assume. A staged testing framework suggests roughly 30 signals as a floor for basic significance testing, with 100 or more preferred for robust inference. Below 30 trades, almost any statistical test is guessing.
If your permutation test shows random entries capturing 70% of your strategy’s performance, the edge isn’t in your entry logic. It’s somewhere else, likely in your exit or position sizing.
Out-of-Sample Confirmation: Walk-Forward, Holdout, and Forward Testing
Walk-forward analysis is the closest thing to a controlled experiment retail traders have access to. The design is simple but the discipline required to run it correctly is not.
Split your data into rolling windows. Optimize the strategy’s parameters on an in-sample (IS) window, then test the frozen parameters on the next out-of-sample (OOS) window immediately following it.
Slide the window forward and repeat. Re-optimize on the new IS period, test on the new OOS period, and continue through your entire dataset.
Calculate walk-forward efficiency (WFE). Compare average OOS performance to average IS performance per fold; a WFE well below 50% signals the strategy is curve-fit to each in-sample window rather than capturing something durable.
Reserve a true holdout you never touch during development. This is the “sacred” one-shot OOS test: lock the exact rule specification, run it once against data set aside from day one, and accept or discard the result. Retuning after seeing a disappointing one-shot result defeats the entire purpose of having a holdout at all.
Move to staged paper trading. Trade the locked specification with no capital, using realistic order types and execution delays, for a pre-defined period or trade count.
Set kill-switch rules before you start. Decide in advance what drawdown, losing streak, or divergence from backtested expectancy will halt the paper test, and write it down before you see a single live signal.
Pro Tip: Write your acceptance and kill-switch rules on paper before the one-shot OOS test runs, not after. If you’re tempted to loosen the criteria once you see the number, you’ve already broken the test.
Execution Realism: Costs, Capacity, and Drawdown Survivability
An edge that looks solid on a spreadsheet can disappear the moment you try to trade it at real size. This stage answers a different question than the statistical tests: not “is this edge real,” but “can I actually capture it?”
Run a capacity test by scaling your assumed fill size up to your intended deployment size and recalculating net expectancy.
Recompute net expectancy after the cost stress; if it turns negative, the edge only exists at a smaller size or a different execution method.
Run Monte Carlo simulations on your trade sequence to estimate P(ruin) and the P5 drawdown, the fifth-percentile worst-case path your account might experience.
Use cluster-robust inference when trades cluster by day, session, or correlated market, since treating clustered trades as independent understates the real variance in your results.
If the edge survives cost stress but drawdown risk exceeds what your account can absorb, reduce position size rather than abandoning the strategy outright.
Minimum track-record length is the detail most traders underestimate. For a strategy with a modest Sharpe ratio, the number of trades needed to statistically confirm skill over luck can run far longer than intuition suggests. If your Monte Carlo path analysis shows a 20% chance of a 40% drawdown at your intended size, that’s not a strategy problem. It’s a sizing problem, and the fix is smaller positions, not a new rule set.
How Do Professional Traders Run a Validation Gauntlet?
Professionals treat validation as a series of gates, not a single green light. The capital-free edge check comes first: trade-log metrics, bootstrap confidence intervals, and permutation reality checks, all run before a single dollar of risk capital gets allocated.
A useful mental model breaks readiness into four gates:
REAL — the edge clears the capital-free check; the bootstrap CI on expectancy excludes zero.
STRONG — the edge survives cost modeling, multiple-comparison correction, and a permutation reality check.
DURABLE — the edge holds across a reserved out-of-sample period and multiple market regimes.
GENERAL — the edge survives paper trading at intended size and capacity stress testing.
Passing REAL means you have something worth testing further. Passing GENERAL means you’re ready to allocate real capital, gradually. Discipline AI’s trade journaling, confidence scoring, execution analytics, and trade autopsy features exist specifically to help traders capture this evidence trail as they move through the gates, turning a scattered set of spreadsheet checks into a documented, repeatable record they can review after every trade.
When Should You Trust a Validated Edge, and When Should You Stay Conservative?
Marginal results deserve marginal sizing. If your bootstrap CI barely clears zero, or your out-of-sample walk-forward ratio is positive but thin, start with a fraction of your planned size and scale up only as more live trades confirm the pattern. Three or four consecutive winning trades after a fragile backtest is not confirmation. It’s a small sample doing what small samples do.
Build operational readiness before you scale: daily and weekly performance reviews against your backtested expectations, a hard kill-switch trigger written down in advance, and periodic re-validation as market regimes shift. An edge that passed every gate in a trending market can fail quietly once conditions turn choppy, which is why strategies built on stable rules still need ongoing monitoring, not a one-time stamp of approval.
The behavioral trap is scaling too fast after an early winning streak. Pre-define your stop criteria for live failure, before you have money on the line, not after a drawdown makes you defensive.
— Tony
Turn Validation Into a Daily Habit With Discipline AI
Running a validation gauntlet by hand in a spreadsheet works until you’re tracking ten strategies across three assets. Discipline AI is built for the trader who wants the evidence trail without the manual bookkeeping: automated trade journaling captures every entry and exit, confidence scores flag setups the platform’s evidence-based calibration has actually backed, and execution analytics show whether slippage is quietly eating your edge at your current size.

The platform’s trade autopsy feature breaks down closed positions the same way this article breaks down a validation gauntlet, showing what worked, what didn’t, and whether the pattern held up statistically or just got lucky. If you want to see how the paper-trading and journaling tools handle the staged testing described above, the Pro plan starts at $8.99 per month, with annual and one-time options also listed on the pricing page. Traders who want a structured program around behavioral discipline can also look at The Disciplined Trader, a one-time offering built around the same evidence-first mindset this article covers. Start by journaling your next ten trades and see what the numbers actually say.
Where to Learn These Validation Methods in More Depth
Running the tests described above is easier with the right tools already built for the job, rather than assembling bootstrap code and walk-forward logic from scratch.
crucible generates capital-free edge reports with expectancy, profit factor, and bootstrap confidence intervals directly from a trade log.
Complete Guide to Validate a Trading Strategy breaks down walk-forward design and how to interpret walk-forward efficiency across folds.
falsify handles PBO and deflated Sharpe calculations so you’re not manually correcting for search-space size.
VARRD’s 10-step testing process lays out the full staged pipeline from hypothesis to one-shot OOS validation.
QuantInsti’s backtesting guide covers Python-based backtesting frameworks that automate cost modeling and chronological data splits.
AeroWealth offers portfolio-level forecasting tools worth pairing with trade-level validation once you’re managing size across multiple strategies.
Start with an edge-level bootstrap tool on your existing trade log, then move to a walk-forward resource once you have a coded strategy worth testing across time.
Sources
FAQ
What Does It Mean to Validate a Trading Edge?
Validating a trading edge means proving, with statistical evidence rather than a good-looking equity curve, that your strategy’s average outcome is genuinely positive and not the product of chance. That typically involves a bootstrap confidence interval on expectancy, an out-of-sample test, and a cost-adjusted backtest that survives realistic slippage and commissions.
What Is a Trading Edge, Exactly?
A trading edge is a repeatable, statistically confirmed advantage that produces a positive expected value over a large number of trades, whether that advantage comes from a technical pattern, a fundamental data signal, or a documented behavioral bias in how other participants react to price moves. It’s the difference between “this looked good on my chart” and “this holds up across 100 or more independent trades with a confidence interval that excludes zero.”
How Much Can a Trader With a $10,000 Account Realistically Make Per Day?
There’s no reliable, verifiable average daily figure for small accounts, because outcomes depend entirely on the strategy’s validated edge, position sizing, and market volatility on a given day. A trader running a genuinely validated edge at conservative size should expect returns measured in expectancy per trade over dozens of trades, not a fixed daily dollar target, and anyone promising a specific daily number for a small account is skipping the validation step entirely.
Is Trading Software That Claims to Find an “Edge” Trustworthy?
Any tool claiming to identify a trading edge should be judged on whether it shows its evidence: expectancy, confidence intervals, and out-of-sample results, not just a backtested equity curve. Discipline AI publishes confidence scores and execution analytics tied to trade outcomes specifically so traders can audit whether a suggested setup has real, calibrated evidence behind it rather than taking a claim on faith.
How Many Trades Do I Need Before I Can Trust My Backtest Results?
Around 30 trades is a practical floor for basic statistical testing, but 100 or more trades gives far more reliable inference about whether an edge is real. Below 30 trades, a bootstrap confidence interval will almost always be too wide to draw a confident conclusion either way.
Recommended


Comments