
Volatility Breakout Strategy: Rules, Automation and Edge


A volatility breakout strategy enters a directional trade the moment price escapes a period of compression, betting that the energy stored during low-volatility consolidation will release into a sustained move. The practical starting point: scan for a Bollinger squeeze or ATR contraction, then require a volume spike significantly above the 20-day average before pulling the trigger. Larry Williams formalized one of the most widely used variants, using prior-day high/low ranges multiplied by a constant to set intraday entry thresholds. Disciplineaiapp can automate the scanning, score the signal, and paper-trade it before you risk a dollar.
The core logic in three points:
Find compression. Bollinger Bands narrow, ATR contracts, and price coils inside a tight horizontal range.
Require confirmation. Volume must expand on the breakout bar; a squeeze alone tells you nothing about direction.
Size by risk, not conviction. Use an ATR-based stop to calculate position size before entry, not after.
Key Takeaways
A volatility breakout strategy only produces a durable edge when compression, volume confirmation, and regime alignment all line up before entry.
Point | Details |
Find compression first | Require Bollinger BandWidth at a multi-period low and ATR contracting for 5–10 bars before any entry. |
Volume is the gatekeeper | A breakout bar must exceed 150% of the 20-day average volume; below that, skip the trade entirely. |
Size by ATR-based risk | Divide your dollar risk per trade by the ATR × 1.5 stop distance to calculate shares or contracts. |
Backtest with realistic costs | Include slippage and commissions; run parameter sweeps and Monte Carlo drawdown tests before going live. |
Disciplineaiapp for the full workflow | The platform scans for compression, scores setups, calculates position size, and supports paper trading before live deployment. |
Table of Contents
What is a volatility breakout strategy and why does it work?
Larry Williams’ volatility breakout rules: entry, sizing, and exit
Automating the strategy: platforms, pseudocode, and pitfalls
How Disciplineaiapp supports the volatility-breakout workflow
Disciplineaiapp gives you the scanning layer you cannot build manually
What is a volatility breakout strategy and why does it work?
Markets alternate between two states: compression and expansion. During compression, realized volatility falls, ATR shrinks, and Bollinger Bands tighten around price. Traders on both sides are waiting. When one side finally commits, the stored energy releases and price can travel quickly.
The Bollinger Band Squeeze, developed by John Bollinger, is the clearest visual signal of this compression. Bands narrow when standard deviation contracts; when they begin to widen again, a volatility expansion is underway. The critical nuance: the squeeze is direction-neutral. It tells you that a move is coming, not which way. That is why confirmation filters exist.
ATR (Average True Range), developed by J. Welles Wilder, measures the average range of recent bars. A falling ATR over 10–14 periods alongside narrowing Bollinger Bands is the classic double-compression signal. On a chart, it looks like a horizontal price shelf with shrinking candle bodies and declining volume. The StockCharts BandWidth indicator quantifies this: low BandWidth readings (using the default 20-period, 2 SD Bollinger setting) flag the precise moment compression is at its tightest, just before the likely expansion.
The strategy works because institutional positioning tends to build during quiet periods. When price finally clears a defined level with volume, it often means the larger participant has committed, and smaller traders pile in behind, extending the move.
Larry Williams’ volatility breakout rules: entry, sizing, and exit
Larry Williams popularized a specific variant that remains widely used in retail trading. The core idea: take the prior day’s range, multiply it by a constant k, and add that value to the prior day’s high (for a long entry) or subtract it from the prior day’s low (for a short entry).
Entry calculation
Calculate the prior day’s range: Range = Prior High – Prior Low
Set your multiplier. A common starting value is k = 0.25 for intraday setups.
Long entry trigger: Prior High + (Range × k)
Short entry trigger: Prior Low – (Range × k)
Place a stop-buy or stop-sell order at those levels at the open.
A worked example: prior day high $105.00, prior day low $100.00, range = $5.00. With k = 0.25, long entry = $105.00 + $1.25 = $106.25. Short entry = $100.00 – $1.25 = $98.75.
Timeframe and instrument parameters
1–5 minute intraday (futures, crypto): k = 0.20–0.30; ATR period = 10; session-open entries only (first 90 minutes for US equities).
Daily swing (large-cap stocks): k = 0.25–0.40; ATR period = 14; entry on next-day open after signal.
Small-cap or crypto (higher volatility): k = 0.40–0.60 to avoid constant triggering on noise.
Stop and target design
Initial stop: Place at ATR × 1.5 below entry for longs (above for shorts). On a $106.25 long entry with ATR = $2.00, stop = $106.25 – $3.00 = $103.25.
Profit target: ATR × 2.5–3.0 from entry, or trail with a 2-ATR trailing stop once price moves 1 ATR in your favor.
Time-based exit: For intraday setups, close all positions 30 minutes before the session close regardless of P&L. Holding through the close on a momentum trade invites gap risk.
Starter vs. full position: Enter 50% of planned size at the trigger. Add the remaining 50% only if price holds above the entry level after one full candle close. This avoids doubling into a head-fake.
How to validate breakouts before entering
A breakout without confirmation is just a price touching a line. Combining Bollinger Band compression, ATR contraction, and declining volume before the break, then requiring a volume spike significantly above the 20-day average on the breakout bar, separates genuine moves from noise.
Volume rules
Require the breakout bar’s volume to exceed a substantial threshold above the 20-day average. Below that threshold, treat the move as unconfirmed.
For tiered sizing: moderate volume spikes justify a starter position; stronger volume spikes justify a full position.
Volume is the most reliable single filter. A price break on thin volume almost always resolves back into the range.
Trend alignment
Check the higher timeframe before entering. A long breakout on a 5-minute chart carries more weight when the daily chart is above its 50-day moving average. Use the best trend indicators for multi-timeframe alignment: a 20/50 EMA stack on the daily, or relative strength versus SPY for individual stocks.
Prefer long breakouts when the broad market (SPY or QQQ) is trending up. Short breakouts in a strong uptrend tend to struggle more and require tighter stops.
Indicator filters
ATR contraction: Confirm ATR has been falling for at least 5–10 bars before the breakout. A rising ATR into the break suggests the market is already expanding, not compressing.
Bollinger BandWidth: Look for BandWidth at a multi-week low. The Bollinger Squeeze is direction-neutral, so pair it with RSI or momentum divergence to infer which side is likely to win.
RSI: A reading near 50 during compression, then breaking above 55 on the breakout bar, suggests building momentum. Divergence between price and RSI during the squeeze can hint at direction.
Pro Tip: Volume overrules single-bar range breaks. If price clears the Williams trigger level but volume is below threshold, skip the trade entirely. In code, this means your entry condition must AND both the price trigger and the volume condition — never OR them.
Position sizing, stops, and stand-aside rules
Risk management in breakout trading is where most traders lose their edge. The entry rule gets all the attention; the sizing and stop rules determine whether you survive long enough to collect it.

Position sizing formula
Shares/contracts = Dollar risk per trade ÷ Stop distance in price
Two worked examples:
Small account ($10,000): Risk 1% per trade = $100. Stop distance = $3.00 (ATR × 1.5 on a $2.00 ATR). Position size = $100 ÷ $3.00 = 33 shares.
Medium account ($50,000): Risk 0.75% per trade = $375. Stop distance = $3.00. Position size = $375 ÷ $3.00 = 125 shares.
For futures or crypto leverage, convert the stop distance to ticks or contract notional. On a micro E-mini S&P (MES), one tick = $1.25. If your stop is 4 ticks, dollar risk per contract = $5.00. At $100 risk, you can trade 20 contracts — but check margin requirements first.
Stop construction options
Fixed pip/point stop: Simple, but ignores current volatility. Works in stable instruments; breaks down in crypto.
ATR × N stop: Adapts to current volatility. ATR × 1.5 is a common starting point; tighten to ATR × 1.0 in high-volatility regimes.
Range-based stop: Place below the compression range low (for longs). Wider than ATR stops but structurally meaningful.
Account-level rules
Maximum daily loss: Stop trading for the day at 2–3% account drawdown. No exceptions.
Maximum open trades: Cap at 3–4 simultaneous breakout positions. Correlation between breakouts in the same sector can amplify drawdown.
Stand-aside logic: Avoid trading during major scheduled news events (FOMC, CPI, NFP). A volatility spike from a news release is not a breakout; it is a lottery ticket. See crypto risk management best practices for a full stand-aside framework.
Scaling out: Take 50% of the position off at ATR × 2.0 profit, then trail the remainder with a 1.5-ATR trailing stop.
Avoiding overleveraging is especially critical in crypto breakouts, where ATR can double overnight and a correctly sized position becomes dangerously large relative to account equity.
How to backtest a volatility breakout system properly
Most traders backtest too optimistically. Realistic slippage, commissions, and out-of-sample testing separate a real edge from curve-fitting.
Backtest checklist
Data quality: Use tick or 1-minute data for intraday systems. Daily OHLCV is sufficient for swing setups. Adjust for stock splits and dividends.
Slippage modeling: Assume at least 0.05–0.10% slippage per side for liquid stocks; 0.15–0.25% for small-caps and crypto. Intraday volatility-breakout backtests that include realistic fees often show materially lower net returns than gross results suggest.
Commission: Include round-trip commissions. At $0.005/share, a 100-share trade costs $1.00 round-trip — small, but it compounds across hundreds of trades.
Out-of-sample testing: Reserve at least 30% of your data for out-of-sample validation. Never optimize parameters on the full dataset.
Essential metrics
Expectancy: (Win rate × Average win) – (Loss rate × Average loss). Positive expectancy is the minimum bar.
Profit factor: Gross profit ÷ Gross loss. Aim for 1.5 or higher after costs.
Max drawdown: The peak-to-trough equity decline. If it exceeds your psychological tolerance, reduce position size before going live.
Sharpe/Sortino ratio: Sortino is more useful for breakout systems because it penalizes only downside volatility.
Win rate and average win/loss: A 40% win rate with a 2.5:1 reward-to-risk ratio is a solid breakout profile. Do not chase win rate at the expense of reward-to-risk.
Sensitivity and robustness tests
If the system only works at k = 0.25 and falls apart at k = 0.24 or 0.26, it is overfit. Use Monte Carlo simulation to stress-test drawdown risk across thousands of randomized trade sequences. A thorough strategy evaluation should also include rolling-window validation across different market regimes — at least one bull, one bear, and one sideways period.
Automating the strategy: platforms, pseudocode, and pitfalls
Platform options
MetaTrader 5 / MQL5: Best for forex and futures. Native tick data, built-in backtester, and a large library of community scripts. MQL5 handles session filtering cleanly with TimeToStruct() and iATR() calls. Latency is low for VPS-hosted EAs.
TradingView / Pine Script: Best for scanning and alerting across hundreds of tickers simultaneously. Pine Script v5 makes multi-timeframe ATR and BandWidth calculations straightforward. For live execution, pair TradingView alerts with a trade copier to push orders to your broker automatically.
Python (ccxt / IB API / REST): Most flexible for crypto and multi-asset portfolios. Use ccxt for crypto exchange connectivity, ib_insync for Interactive Brokers. Python handles custom position sizing and portfolio-level risk checks better than either MT5 or Pine.
Pseudocode outline
// Each bar close:
1. Calculate ATR(14) and BollingerBandWidth(20, 2)
2. If ATR < ATR_threshold AND BandWidth < BW_threshold → compression confirmed
3. Calculate Williams entry levels:
   long_entry = prior_high + (prior_range × k)
   short_entry = prior_low - (prior_range × k)
4. On next bar open:
   If price >= long_entry AND volume > 1.5 × avg_volume_20:
     size = risk_dollars / (long_entry - ATR × 1.5)
     enter long at market, set stop at long_entry - ATR × 1.5
   If price <= short_entry AND volume > 1.5 × avg_volume_20:
     size = risk_dollars / (ATR × 1.5)
     enter short at market, set stop at short_entry + ATR × 1.5
5. Trail stop by ATR × 1.5 once position is profitable by ATR × 1.0
6. Time-based exit: close all positions 30 min before session end
Common pitfalls
Intrabar triggers: Using request.security() in Pine Script on the current bar (not closed) causes look-ahead bias. Always use barstate.isconfirmed or [1] offset.
Timezone mismatches: A 9:30 AM EST session open in UTC is 14:30. Hardcoding the wrong timezone silently shifts your entry window by hours.
Volume thresholds by market cap: A 150% volume spike means something different for Apple than for a $200M small-cap. Calibrate thresholds per instrument.
Single-indicator confirmation: Triggering on price alone, without the volume AND ATR conditions, is the fastest way to accumulate false breakout losses.
Pro Tip: Always use candle-close confirmation, not intrabar price. A bar that touches your trigger level intrabar but closes back inside the range is a head-fake, not a breakout. One confirmed close outside the range is worth more than three intrabar touches.
A step-by-step worked trade from scan to exit
This example uses a daily-chart squeeze breakout on a liquid large-cap stock.
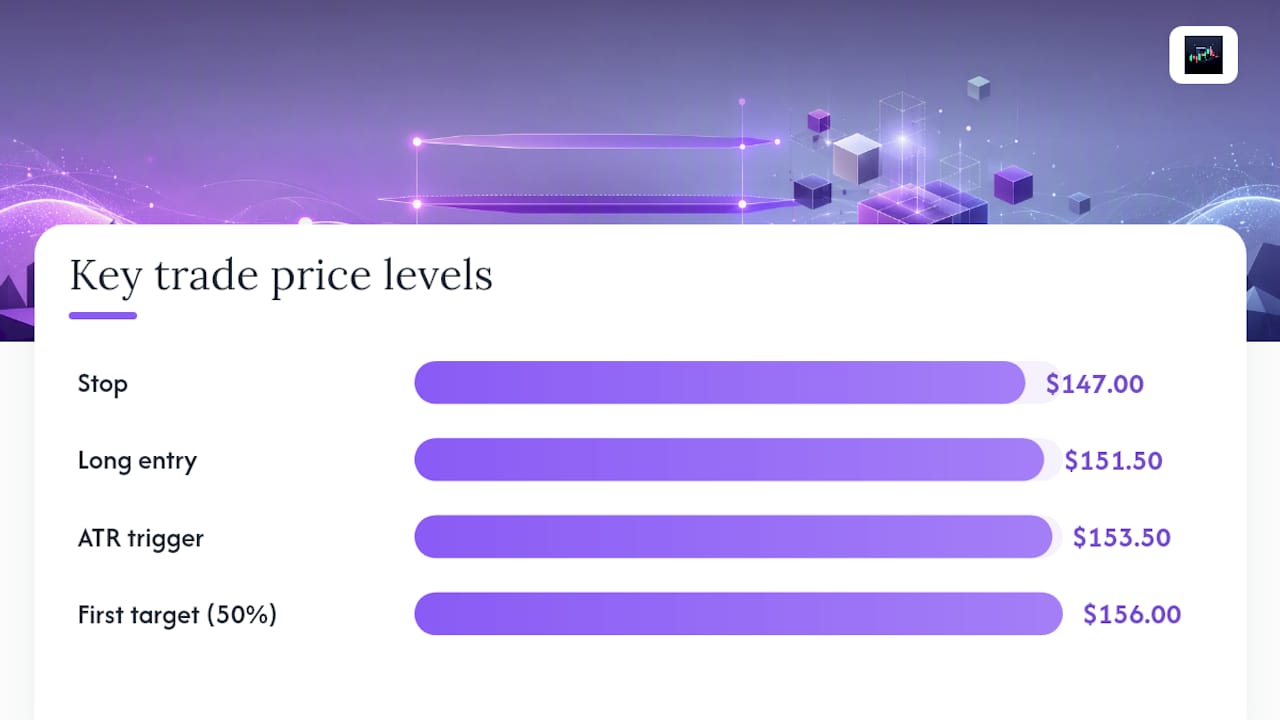
Scan: Filter for stocks where Bollinger BandWidth is at a 20-day low AND ATR(14) has declined for 7 consecutive days AND 20-day average volume is above 500,000 shares. This narrows a universe of 500 stocks to roughly 10–20 candidates.
Define levels: Prior day high = $150.00, prior day low = $144.00, range = $6.00. With k = 0.25: long entry = $151.50, short entry = $142.50.
Set alerts: Place a price alert at $151.50 AND a volume alert at 150% of the 20-day average. Both must trigger before acting.
Starter entry: When both alerts fire, enter 50% of planned size at market. Stop = $151.50 – (ATR × 1.5) = $151.50 – $4.50 = $147.00.
Add to position: If price closes above $151.50 on the first full daily bar, add the remaining 50%. Do not add if the close is below the entry trigger.
Manage the trade: Move stop to breakeven ($151.50) once price reaches $151.50 + ATR = $153.50. Trail by ATR × 1.5 thereafter.
Scale out: Sell 50% at $151.50 + (ATR × 2.5) = $156.00. Trail the rest.
Time/target exit: If price has not reached the first target within 5 trading days, exit the full position at market close on day 5.
Pro Tip: Size the second tranche at the same dollar risk as the first, not the same share count. If the stock has moved up and your stop is now tighter (breakeven), the second tranche can actually be larger in shares while keeping dollar risk identical. This is how you build size into a confirmed move without averaging up blindly.
When volatility breakouts work and when they fail
The edge in squeeze-breakout entries depends almost entirely on regime. In trending, expanding markets, breakouts follow through. In choppy, mean-reverting markets, they fail repeatedly and erode capital through small losses.
Regime indicators to watch
VIX: A rising VIX above 20 can signal genuine expansion, but a VIX spike above 30 often means panic, not breakout. Breakouts during panic tend to reverse.
Rolling ATR behavior: If ATR is expanding across the broad market (SPY, QQQ), breakouts have more follow-through. A contracting broad-market ATR suggests range-bound conditions.
Breadth: When more than 60% of S&P 500 stocks are above their 50-day moving average, long breakouts have historically outperformed short ones.
Common failure modes
Head fakes: Price clears the trigger level on one bar, then reverses. Professionals mitigate this by waiting for candle closes outside the range rather than intrabar touches.
Distribution spikes: A stock in a distribution phase (institutional selling) can spike above resistance on one bar before collapsing. Volume pattern matters: genuine breakouts show sustained volume, not a single spike followed by drying up.
Breakouts against broad market weakness: A long breakout on an individual stock while SPY is breaking down rarely holds. Always check the macro tape.
Adaptation checklist
In choppy regimes: tighten the volume threshold to 200%+ of average and require two consecutive closes outside the range.
When ATR is expanding broadly: widen stops to ATR × 2.0 to avoid being shaken out of real moves.
When the strategy is failing repeatedly (3+ consecutive losses): stop trading it and switch to a mean-reversion approach until regime conditions improve.
How Disciplineaiapp supports the volatility-breakout workflow
Disciplineaiapp is a trading intelligence platform, not an investment advisor. Its role in this workflow is to automate the scanning and validation steps that are tedious to do manually across dozens of assets.
Platform capabilities mapped to the workflow
Real-time compression scanning: Disciplineaiapp monitors volatility, market structure, and liquidity events across multiple assets and timeframes, flagging compression setups before they break.
Multi-timeframe alignment: The platform checks trend conditions across timeframes simultaneously, so you are not entering a long breakout against a bearish higher-timeframe structure.
AI-generated confidence scores: Each setup receives a confidence score based on historical pattern matching and current market conditions. Use these conservatively: a high score narrows the field; it does not guarantee follow-through.
Position-sizing calculator: Built-in risk tools calculate position size from your dollar risk and ATR-based stop distance, removing the manual arithmetic that causes sizing errors under pressure.
Paper trading and trade autopsies: Before committing live capital, run the strategy through Disciplineaiapp’s paper trading module with full P&L tracking. The AI autopsy feature then dissects each trade, showing where execution quality diverged from the plan.
Stand-aside protection: The platform’s stand-aside logic flags low-quality breakout conditions and scheduled news events, matching the regime-filter rules described earlier.
Pro Tip: Use Disciplineaiapp’s stand-aside and scheduled-news protections as a hard gate, not a suggestion. If the platform flags a stand-aside condition, treat it the same way you would treat a maximum daily loss limit: the trade does not happen, regardless of how good the setup looks.
The part most traders get backwards
That is exactly backwards. The Larry Williams entry formula is simple arithmetic anyone can code in an afternoon. What actually determines whether you make money over 200 trades is the regime filter, the stand-aside logic, and the position sizing.
The Bollinger squeeze is one of the most widely known setups in retail trading, which is also its biggest liability. When a setup is this well-known, the head-fake rate rises because other traders are watching the same level and fading the initial break. The traders who survive this are not the ones with a better entry formula. They are the ones who wait for a confirmed close, require genuine volume, and sit out when the macro tape is working against them.
Automation helps, but it introduces a different failure mode: the illusion of discipline. A bot that fires on every trigger regardless of regime will grind out losses in choppy markets just as mechanically as it captures gains in trending ones. The stand-aside logic is not optional plumbing; it is the core of the system.
The practical priority order: get the regime filter right first, then the volume confirmation, then the entry formula. Most traders do it in reverse and wonder why their backtest does not match their live results.
Disciplineaiapp gives you the scanning layer you cannot build manually
Scanning 50 assets simultaneously for Bollinger compression, ATR contraction, and volume patterns while also checking multi-timeframe trend alignment is not a realistic manual workflow. Disciplineaiapp handles that layer automatically, delivering AI-scored setups with confidence ratings, built-in position sizing, and stand-aside flags for news events and weak-regime conditions.

The paper trading module lets you run the full volatility-breakout workflow, from scan to exit, without live capital. Every trade gets an AI autopsy showing where execution matched the plan and where it diverged. That feedback loop, applied consistently before you go live, is what separates traders who build a real edge from those who discover their system’s flaws with real money on the line.
Start with the Discipline AI Learning Center to work through the strategy automation tutorials and risk management tools built specifically for this kind of systematic trading.
This article is general information, not a substitute for advice from a qualified financial advisor. Consult a qualified financial professional about your own circumstances before acting on anything here.
Sources
The resources below cover the foundational concepts and practical implementation details referenced throughout this guide.
Recommended

Comments