
Traders: Seven Fields, Under 60 Seconds to Fix Outcome Tracking
- Discipline AI

- 2 days ago
- 8 min read

Outcome tracking is the practice of recording every trade’s data and reviewing it against fixed metrics to see whether a strategy actually works. Start today: log each trade with date, ticker, side, entry, stop, size, and P&L the moment you close the position. That single habit exposes which setups make money, which ones bleed it, and where your expectancy quietly turns negative.
TL;DR:
Proper outcome tracking requires recording key trade details such as date, time, asset, direction, entry, exit, and P&L to accurately analyze strategy effectiveness.
Adding qualitative notes, emotional states, and artifacts like charts enhances understanding of why trades succeed or fail and helps identify behavioral patterns.
Using templated systems with dropdown tags, auto-import features, and quick entry methods maintains consistency without slowing down trading or review routines.
Metrics like profit factor, expectancy, R-multiple distribution, and maximum drawdown provide a clearer picture of strategy performance than win rate alone.
Regular weekly and monthly reviews focused on performance by setup and session help traders identify leaks, assess fee impacts, and determine when to adjust or pause specific strategies.
Table of Contents
What to Record for Real Outcome Tracking in Trading
Most traders track price and profit and stop there. That leaves half the story untold, because a losing month with tight risk control is a different problem than a losing month from oversized bets on the wrong setup. You need both the numbers and the context behind them.
Non-negotiable trade fields go in every single entry, no exceptions:
Date and time (entry and exit)
Ticker or asset and direction (long or short)
Entry price, exit price, position size
Stop loss level and target level
P&L in dollars and in R-multiples
Commissions, fees, and funding costs
The Paper Trading Journal guide lists this same minimum set, entry, exit, stop, P&L, setup type, and notes, and ties consistent journaling of these fields to steady improvement over time. That’s not a coincidence. Each field maps to a downstream calculation: entry and stop give you your R-multiple, size and P&L give you position sizing accuracy, and timestamps let you slice performance by session or time of day.
Beyond the numbers, add quantitative tags: setup type (breakout, pullback, reversal), timeframe, trading session, and the position sizing method used. These tags are what let you later ask “how does my 5 minute breakout setup perform versus my daily reversal setup” instead of staring at one blended equity curve that hides both a winning system and a losing one.
Then there’s the qualitative layer, the part most traders skip because it feels like extra homework. Write one sentence on why you entered. Note the broader market context (trending, choppy, news-driven). Rate your emotional state before, during, and after the trade. Flag any deviation from your plan, did you move your stop, size up out of frustration, or exit early out of fear?
Finally, attach artifacts. A chart screenshot at entry and exit, the actual order fill confirmation, and a marker for which session you were trading in turn a text log into something you can actually re-examine six months later and understand.
Building a Trade Log That Doesn’t Slow You Down
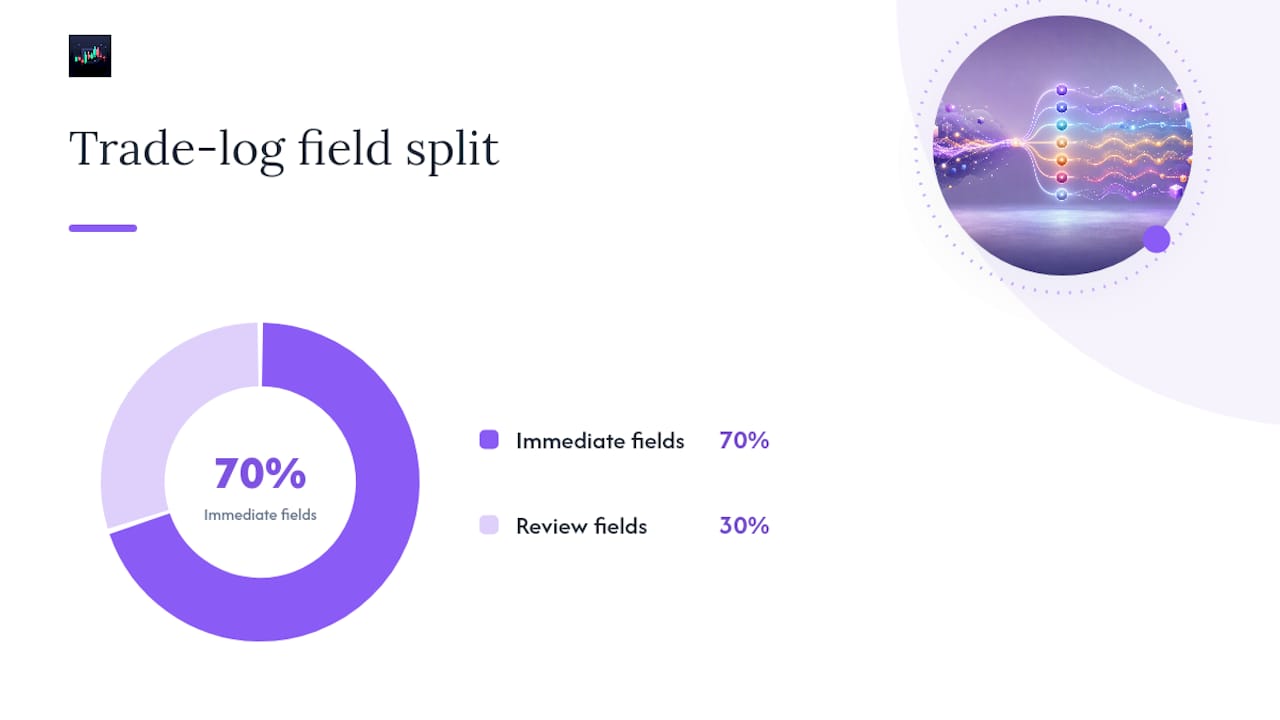
A logging system that takes ten minutes per trade dies within two weeks. Separate your schema into two tiers: a minimal set you fill in immediately (ticker, side, entry, exit, size, P&L, setup tag) and an optional set you can backfill during your weekly review (notes, screenshots, emotional rating). This split keeps the habit sustainable.
Build a tag taxonomy before you need it, not after. Setup tags might include breakout, mean reversion, or trend continuation. Error tags might include “moved stop,” “sized up on revenge,” or “chased entry.” Session tags separate Asia, London, and New York hours if you trade crypto or forex across time zones.
Three speed tricks make the biggest difference:
Build a template (spreadsheet row or app entry) with dropdown menus for tags so you’re clicking, not typing, during a live session.
Use broker auto-import wherever available, since manually re-entering fills introduces errors and eats time you should spend reviewing, not transcribing.
Screenshot on close and paste directly into your log entry rather than saving files to a folder you’ll never open again.
Get commissions, funding fees, and overnight financing entered as their own line item, not folded silently into your P&L number. A strategy that looks profitable before fees can flip negative after them, and you won’t catch that if fees are invisible in your log.
Pro Tip: Keep your minimal template to seven fields max. If you can’t fill it out in under sixty seconds after closing a trade, you’ll skip it on your worst days, which are exactly the days you need the data most.
Which Metrics Actually Tell You If Your Strategy Works?
Win rate alone tells you almost nothing. A strategy with a low win rate can be highly profitable if winners run significantly larger than losers, and a high win rate strategy can lose money if losses are left to run. The metrics that matter work together, not in isolation.
Win rate: winning trades divided by total trades
Average win/loss: average dollar or R gain on winners versus average loss on losers
Profit factor: gross profit divided by gross loss; above 1.5 is generally healthy, below 1.2 signals a strategy under strain
Expectancy: (win rate × average win) minus (loss rate × average loss); this is your per-trade edge in dollars or R
Average R-multiple: your typical reward relative to risk across all trades
Max drawdown: the largest peak-to-trough decline in your equity curve
TradeLogr’s guide to tracking trades recommends plotting these metrics across multiple recent time windows rather than relying on lifetime averages, since edge decay shows up in trend lines long before it shows up in a single bad week.
Your equity curve’s shape matters as much as its slope. A performance chart that layers cumulative P&L against maximum favorable and adverse excursion (MFE/MAE) reveals whether you’re leaving profit on the table by exiting too early, or giving profit back by holding too long. A curve that climbs steadily with shallow drawdowns says something very different than one that spikes and gives it all back.
Break your R-multiples into a histogram instead of a single average. A cluster of small losers with a few outsized winners describes a very different trading style than a tight distribution around break-even. Then slice everything by tag: performance by setup, by session, by time of day. This is where the real leaks hide, often in one specific setup or one trading window dragging down an otherwise solid system.
Set concrete thresholds that trigger action. If profit factor drops below 1.2 for two consecutive months, pause that setup and investigate before adding size. If expectancy turns negative on any tag, that’s not noise, that’s a strategy telling you something.
How to Run a Weekly and Monthly Trading Review
Tracking data without reviewing it is just digital hoarding. The review is where outcome data becomes a decision.
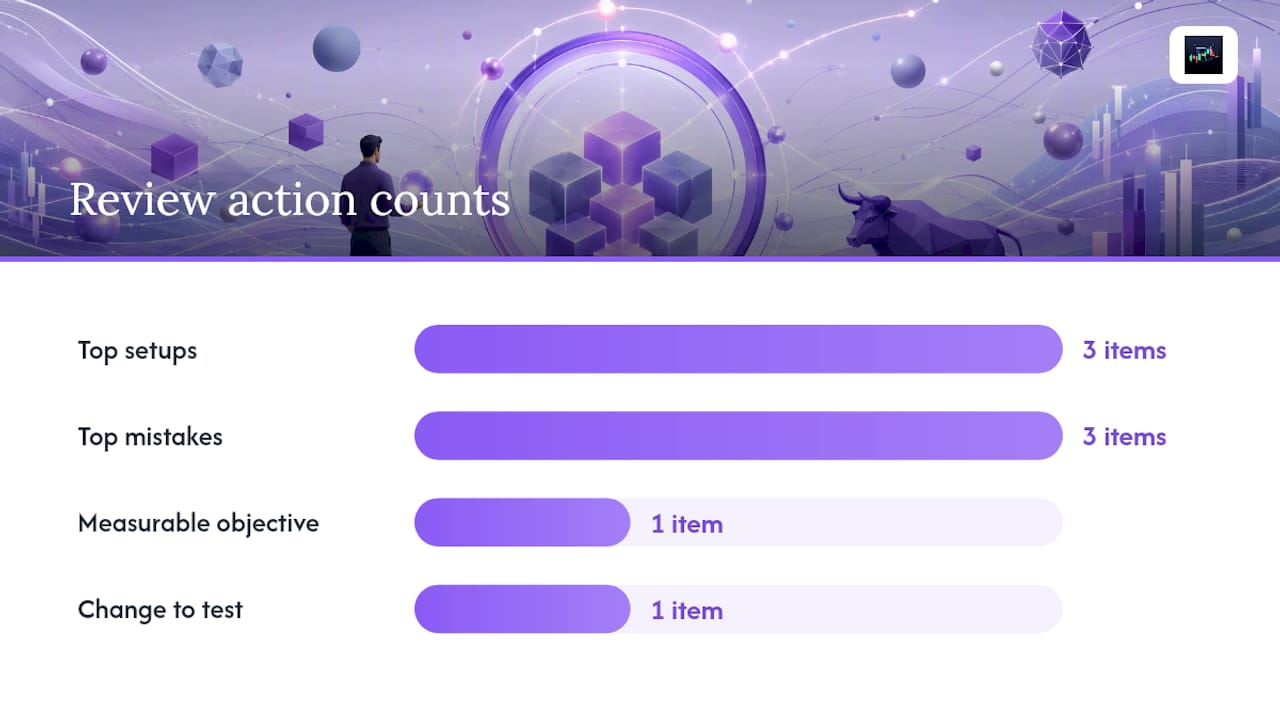
Weekly review (10 to 30 minutes): Pull your top three performing setups and your top three mistakes from the week. Filter by session to see if certain hours are dragging your numbers down. Pick one measurable objective for next week, something like “no entries without a written reason” or “cut average loss size by 10%.”
Monthly audit: Calculate expectancy by setup tag, not just overall. Identify the root cause of your largest drawdown, was it one bad trade or a string of small ones? Check fee impact on your net returns. Reassess whether your position sizing method still fits your account size and risk tolerance.
Test one change at a time: Adjust a single variable, entry timing, stop placement, position size, and give it at least 20 trades before drawing a conclusion.
Pro Tip: Block your weekly review on your calendar the same way you’d block a client meeting. Reviews that depend on “whenever I have time” almost never happen, especially after a losing week when you’d rather not look.
Automated weekly reports remove the friction of manually pulling numbers, and a standing calendar block creates the accountability that turns a review from optional to routine.
What Actually Matters When Choosing a Journaling Tool
Skip the marketing copy and check for accurate mechanics first. A tool needs broker auto-import, correct fee handling in P&L calculations, and automatic computation of win rate, profit factor, and expectancy, because manual math introduces errors that compound over hundreds of trades. Automated import and correctly calculated metrics save real hours compared to spreadsheets and reduce the missing-trade bias that comes from forgetting to log a losing trade.
Tagging, screenshots, and equity curve visualization should come standard
Export functionality matters if you ever want to run your own analysis outside the app
Pre-trade checklists and tilt detection add real behavioral value beyond passive record keeping
Watch for opaque profit calculations, missing fee handling, and dashboards built for vanity metrics instead of decision-making
A spreadsheet works fine when you’re trading fewer than a handful of setups and don’t mind manual entry. Once you’re trading multiple instruments or want automated behavioral flags, a purpose-built trade journal starts paying for itself in saved time and caught mistakes. Capterra reviews consistently point to usability and reliable calculations as the deciding factors traders cite when a journaling tool actually sticks.
How Discipline AI Turns Logged Trades Into Fixes
Automated journaling only helps if it connects behavior to outcomes. Discipline AI imports trade history, tags setups automatically, and runs AI trade autopsies that flag patterns like sizing up after a loss or ignoring stop discipline on a specific setup. A trader who repeatedly overrides stops on breakout trades gets flagged with the specific pattern, not a vague “be more disciplined” note. That specificity is what changes behavior.
A Trader’s Honest Take on Journaling
Most traders quit journaling not from laziness but because their template asks for too much. Start with seven fields. Add complexity only once the habit sticks.
— Tony
Let Discipline AI Handle the Logging So You Can Focus on the Fixes
Manual journaling works until you’re trading five setups across three sessions, and then the spreadsheet becomes the thing you skip on your busiest, most important days. Discipline AI automates the part that breaks first: it imports your trade history, calculates win rate, expectancy, and profit factor without manual math, and runs AI trade autopsies that flag the specific behavioral pattern behind a losing streak, not just the losing streak itself.

The behavioral coaching layer is what separates this from a standard spreadsheet or basic journal app. Instead of a dashboard full of numbers you have to interpret yourself, you get a flagged pattern, like sizing up after two losses, tied directly to the trades that prove it. If your current process involves stitching together broker exports and a notes app, try Discipline AI and see your first automated trade autopsy after your next session.
Sources
For deeper technical detail on the mechanics covered here: TradingView’s performance chart documentation explains MFE/MAE and drawdown visualization. The Paper Trading Journal guide covers minimum journal fields in depth. Options traders should also see this guide to tracking options trades systematically, and equity traders can review why tracking stock performance matters.
Recommended


Comments