
Size Positions With 30–90 Day Risk Adjusted Returns for Active Traders
- Discipline AI

- 6 hours ago
- 7 min read

Risk-adjusted return measures how much profit you earned for every unit of risk you took on, and it’s the only honest way to judge a trading strategy; understanding risk-adjusted returns helps you compare and apply these metrics effectively. Before you trust a return number, compute the Sharpe ratio and Sortino ratio, then check maximum drawdown. Discipline AI’s performance analytics run these checks automatically, but you need to understand what they mean.
TL;DR:
A Sharpe ratio above 1.0 is acceptable, but ratios calculated from fewer than 30 trades are unreliable and should be treated as hypotheses.
The Sortino ratio is typically higher than the Sharpe ratio for the same data because it only penalizes downside volatility, which is relevant for asymmetric return strategies.
Combining multiple metrics like Sharpe, Sortino, and Calmar, and validating them with out-of-sample data, improves accuracy and reduces risks of overfitting.
Position sizes should be adjusted based on real-time risk-adjusted performance metrics, especially if the Sharpe drops significantly or drawdowns threaten survivability.
Using automated performance analytics helps monitor risk and adjust strategies quickly, especially when managing multiple assets or volatile markets like crypto.
Table of Contents
How to Calculate Risk-Adjusted Return: Sharpe, Sortino, Treynor, and Calmar
Four formulas cover most of what you’ll ever need to evaluate a trading strategy for risk-adjusted return trading purposes, and each answers a slightly different question.
Sharpe ratio. (Portfolio Return − Risk-Free Rate) ÷ Standard Deviation of Returns. This is the industry default, and it’s what allocators ask for first. Its weakness is that it treats upside volatility the same as downside volatility, which can penalize a strategy for winning too unpredictably.
Sortino ratio. (Portfolio Return − Minimum Acceptable Return) ÷ Downside Deviation. Swap standard deviation for downside deviation and you get a metric that only punishes the volatility you actually care about. It’s the better choice for strategies with asymmetric return profiles, like trend-following systems that let winners run.
Treynor ratio. (Portfolio Return − Risk-Free Rate) ÷ Beta. This one only makes sense when your strategy has a high R-squared against a benchmark. Use it for diversified equity exposure, not for a concentrated crypto book with no meaningful beta to anything.
Calmar (or MAR) ratio. CAGR ÷ Maximum Drawdown. This is the metric that ties return directly to your worst historical loss, and it’s arguably the most useful one for traders who care about survivability over bragging rights.
Here’s a worked example.
Sharpe: (22 − 4) ÷ 15 = 1.2Sortino: (22 − 4) ÷ 9 = 2.0Calmar: 22 ÷ 18 = 1.22
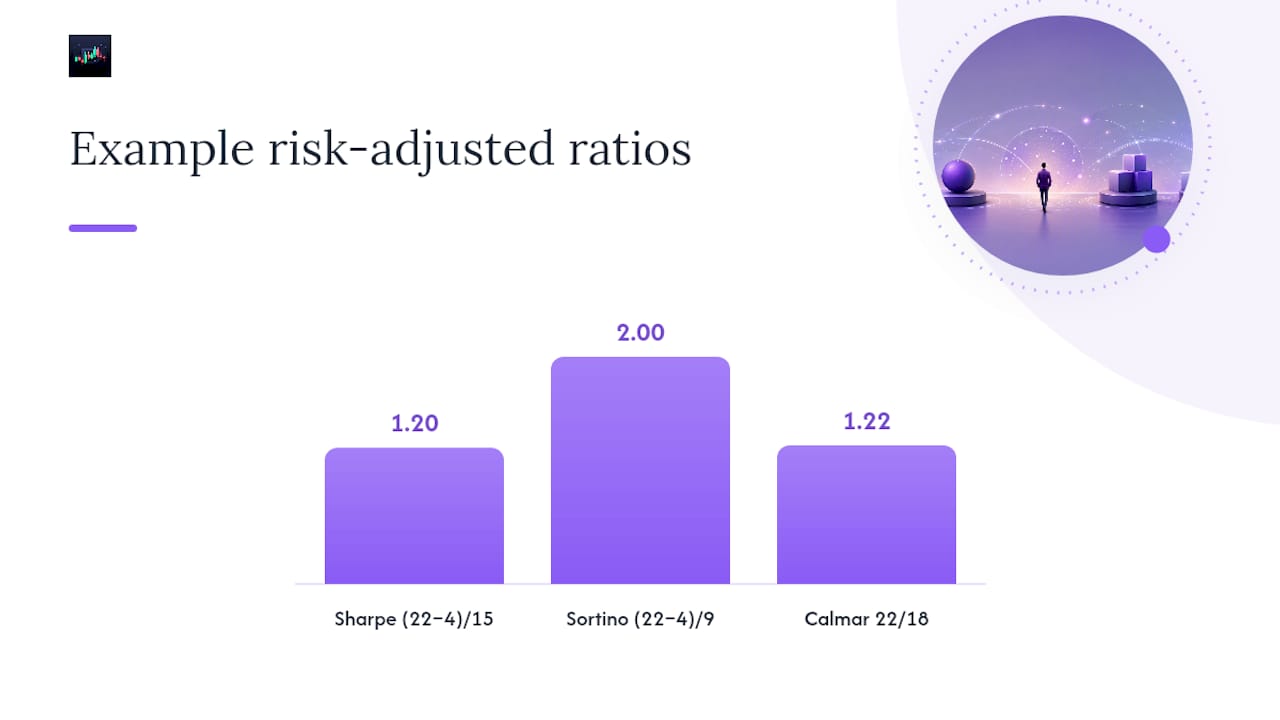
Notice the gap between Sharpe and Sortino. That spread tells you the strategy’s losses are smaller and less frequent than its total volatility suggests, which is exactly the kind of signal a raw return number can never show you.
What Counts as a Good Sharpe or Sortino Ratio?
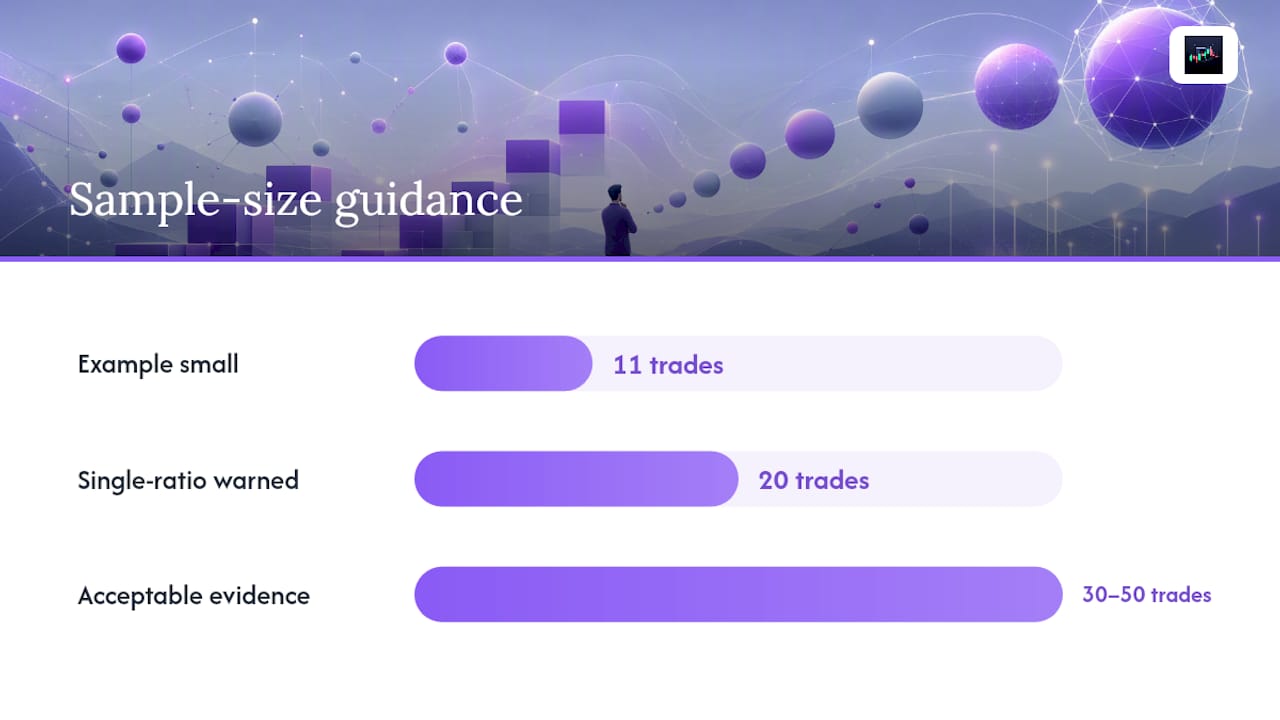
Numbers without context are useless, and this is where most traders get burned. A Sharpe of 1.2 sounds respectable until you realize it came from eleven trades over three months.
A Sharpe ratio above 1.0 is generally considered acceptable, higher values indicate stronger performance, but very high values should be approached with caution and scrutiny of the backtest itself.
Sortino ratios typically run higher than Sharpe on the same data because downside deviation is usually smaller than total standard deviation. A Sortino of 2.0 on a trend strategy isn’t necessarily better than a Sharpe of 1.0 on a market-neutral one.
Small sample sizes inflate confidence. A high Sharpe calculated from a short track record is statistically unreliable until you’ve validated it out-of-sample or built a confidence interval around it.
Skewed return distributions, common in options-selling and crypto momentum strategies, can make Sharpe look strong until a rare adverse event causes significant losses.
Trend-following systems tend to post modest Sharpe ratios but strong Calmar ratios, because they lose small and win big. Market-neutral strategies usually run the opposite profile with relatively higher Sharpe ratios and less remarkable Calmar ratios, reflecting steady but capped returns. Crypto strategies distort almost every metric due to extreme volatility clustering, which is exactly why different allocators lean on different ratios depending on what risk they’re actually trying to price.
A single ratio, calculated on 20 trades, tells you almost nothing. Treat any metric built on fewer than 30 to 50 independent trades as a hypothesis, not a conclusion.
Turning the Numbers Into Trading Rules
Metrics only matter if they change what you do Monday morning. Here’s how to translate risk-adjusted return trading calculations into actual position management.
Size positions to your realized Sharpe, not your hoped-for Sharpe. If your trailing 90-day Sharpe drops from 1.4 to 0.6, cut position size proportionally until performance recovers. Don’t wait for a drawdown to force your hand.
Set a hard maximum drawdown limit before you trade, not after. If your Calmar ratio implies a strategy needs a 25% drawdown to justify its returns, ask honestly whether you can survive that emotionally and financially. Most retail traders can’t.
Run rolling 30 and 90 day windows on Sharpe and Sortino, not just the all-time number. A strategy that looked great for two years and terrible for the last two months has a regime problem, not a temporary rough patch.
Build explicit halt rules. If drawdown exceeds your Calmar-implied ceiling, or if downside deviation spikes 50% above its trailing average, cut size in half or step aside entirely until conditions normalize.
Reduce leverage as realized volatility rises, even if your win rate hasn’t changed. Volatility expansion erodes your Sharpe faster than most traders notice in real time.
Pro Tip: Track your Sortino ratio on a rolling weekly basis, not just monthly. Downside deviation shifts faster than most traders expect, and a weekly check catches a deteriorating strategy two or three weeks before a monthly review would.
Position sizing tied to volatility, rather than a fixed dollar amount or fixed contract count, is the single biggest lever most traders never pull. It’s covered in more depth in Disciplineaiapp’s guide to crypto risk management, which walks through downside-focused sizing frameworks for volatile assets.
Building a Trading Tearsheet You Can Trust
A proper tearsheet isn’t a vanity report. It’s the document that keeps you honest about whether a strategy deserves more capital or less.
Core fields: CAGR, annualized volatility, Sharpe, Sortino, Calmar, maximum drawdown, and total trade count. Trade count matters more than most traders admit, since a beautiful Sharpe on 15 trades is closer to noise than signal.
Confidence checks: run an out-of-sample test on data the strategy never saw during development, and calculate a probabilistic Sharpe ratio to see how likely your result is to hold given the sample size. Confidence intervals around Sharpe separate a real edge from a lucky streak.
Monte Carlo resampling on your trade sequence shows you a distribution of possible drawdowns, not just the one you happened to experience. Disciplineaiapp’s Monte Carlo simulation guide covers how to stress-test a strategy this way before risking live capital.
Act on the output, not just admire it. If out-of-sample Sharpe falls below half your in-sample Sharpe, that’s a red flag for overfitting, and it should reduce your allocation before it reduces your account balance.
Practitioner guidance consistently points to reporting all three core ratios together with a one-line interpretation each, rather than leading with whichever number looks best.
For traders building this workflow from scratch, Disciplineaiapp’s breakdown of evaluating a strategy with real trade data and its backtesting software comparison both cover the mechanics of running these checks before you scale a strategy up.
How Discipline AI Surfaces These Metrics in Live Trading
Discipline AI’s performance analytics calculate Sharpe, Sortino, and max drawdown automatically from your trade journal, so you’re not rebuilding spreadsheets after every session.
Confidence scores on each AI-generated trade setup account for current volatility conditions, which means position-sizing suggestions adjust as your realized risk profile changes.
Trade autopsies break down why a losing streak happened, helping you distinguish a genuine regime shift from ordinary variance.
Stand-aside protection flags conditions where sitting out preserves your risk-adjusted return better than forcing a trade.
Behavioral coaching alerts trigger when downside deviation trends upward, prompting a size reduction before drawdown does it for you.
Survivability Beats Peak Returns
Every trader I’ve seen chase a headline return number eventually meets the drawdown that erases it. Risk-adjusted metrics matter because they price in the part of trading that ego ignores: the cost of staying in the game long enough to compound.
Combine at least two ratios, validate with out-of-sample data, and never trust a number built on a handful of trades. Monitor Sharpe and Sortino as a routine, not a one-time report card. Consistency beats optimization every time.
— Tony
Where to Apply This With Discipline AI
Calculating Sharpe and Sortino by hand every week gets old fast, especially when you’re trading across multiple crypto pairs and timeframes. Disciplineaiapp built its performance analytics specifically so these numbers update automatically alongside your trade journal, rather than living in a separate spreadsheet you forget to update.

That matters most for active crypto and multi-asset traders who need to see a Sharpe or Sortino shift before a small drawdown becomes a large one. The platform pairs those metrics with confidence scores and stand-aside protection, so a deteriorating risk-adjusted return actually triggers a sizing suggestion instead of sitting unnoticed in a report. For a deeper look at how the calculations connect to trade setups and coaching, visit the AI Learning Center and see how the metrics apply to your own trade history.
This article is general information, not a substitute for advice from a qualified financial advisor. Consult a qualified financial professional about your own circumstances before acting on anything here.
Sources
Recommended


Comments